External link
Symbol
Arabidopsis homologues
Locus ID
BLAST score/e-value
TF class
Alias
TAIR10 short description
AT4G22200 132 / 3e-36
AKT3, AKT2/3
potassium transport 2/3 (.1)
AT4G32500 94 / 7e-23
AKT5
K+ transporter 5, K+ transporter 5, K+ transporter 5 (.1)
AT2G25600 87 / 4e-20
AKT6, SPIK
Shaker pollen inward K+ channel, Shaker pollen inward K+ channel (.1)
AT4G18290 86 / 4e-20
KAT2
potassium channel in Arabidopsis thaliana 2 (.1)
AT5G46240 86 / 8e-20
KAT1
potassium channel in Arabidopsis thaliana 1 (.1)
AT2G26650 79 / 2e-17
AKT1, ATAKT1
K+ transporter 1, K+ transporter 1, K+ transporter 1 (.1)
AT4G32650 77 / 8e-17
AtLKT1, KAT3, ATKC1
A. thaliana low-K+-tolerant 1, ARABIDOPSIS THALIANA K+ RECTIFYING CHANNEL 1, potassium channel in Arabidopsis thaliana 3 (.1.2.3)
AT5G37500 69 / 3e-14
GORK
gated outwardly-rectifying K+ channel, gated outwardly-rectifying K+ channel (.1)
AT3G02850 69 / 6e-14
SKOR
STELAR K+ outward rectifier, STELAR K+ outward rectifier (.1)
Paralogs
Gene ID
BLAST score/e-value
At best hit
BLAST score/e-value
TAIR10 short description
Lus10019944
132 / 2e-36
AT4G22200 1111 / 0.0
potassium transport 2/3 (.1)
Lus10015474
131 / 8e-36
AT4G22200 1093 / 0.0
potassium transport 2/3 (.1)
Lus10028128
85 / 2e-19
AT5G46240 827 / 0.0
potassium channel in Arabidopsis thaliana 1 (.1)
Lus10042831
85 / 2e-19
AT5G46240 825 / 0.0
potassium channel in Arabidopsis thaliana 1 (.1)
Lus10043298
83 / 9e-19
AT2G26650 1250 / 0.0
K+ transporter 1, K+ transporter 1, K+ transporter 1 (.1)
Lus10017766
81 / 3e-18
AT2G26650 719 / 0.0
K+ transporter 1, K+ transporter 1, K+ transporter 1 (.1)
Lus10019442
81 / 4e-18
AT2G26650 1252 / 0.0
K+ transporter 1, K+ transporter 1, K+ transporter 1 (.1)
Lus10033052
80 / 7e-18
AT2G26650 1211 / 0.0
K+ transporter 1, K+ transporter 1, K+ transporter 1 (.1)
Lus10007670
78 / 3e-17
AT4G32650 724 / 0.0
A. thaliana low-K+-tolerant 1, ARABIDOPSIS THALIANA K+ RECTIFYING CHANNEL 1, potassium channel in Arabidopsis thaliana 3 (.1.2.3)
Locus ID
BLAST score/e-value
At best hit
BLAST score/e-value
TAIR10 short description
Potri.003G018800
133 / 2e-36
AT4G22200 1045 / 0.0
potassium transport 2/3 (.1)
Potri.004G132200
84 / 2e-19
AT5G46240 913 / 0.0
potassium channel in Arabidopsis thaliana 1 (.1)
Potri.018G071400
81 / 3e-18
AT2G26650 1192 / 0.0
K+ transporter 1, K+ transporter 1, K+ transporter 1 (.1)
Potri.006G249900
79 / 1e-17
AT2G25600 1065 / 0.0
Shaker pollen inward K+ channel, Shaker pollen inward K+ channel (.1)
Potri.006G245000
78 / 4e-17
AT4G32650 752 / 0.0
A. thaliana low-K+-tolerant 1, ARABIDOPSIS THALIANA K+ RECTIFYING CHANNEL 1, potassium channel in Arabidopsis thaliana 3 (.1.2.3)
Potri.012G124944
77 / 4e-17
AT4G32650 734 / 0.0
A. thaliana low-K+-tolerant 1, ARABIDOPSIS THALIANA K+ RECTIFYING CHANNEL 1, potassium channel in Arabidopsis thaliana 3 (.1.2.3)
Potri.018G035500
77 / 9e-17
AT4G32650 777 / 0.0
A. thaliana low-K+-tolerant 1, ARABIDOPSIS THALIANA K+ RECTIFYING CHANNEL 1, potassium channel in Arabidopsis thaliana 3 (.1.2.3)
Potri.018G031600
75 / 5e-16
AT2G25600 1078 / 0.0
Shaker pollen inward K+ channel, Shaker pollen inward K+ channel (.1)
Potri.017G135400
66 / 4e-13
AT3G02850 1269 / 0.0
STELAR K+ outward rectifier, STELAR K+ outward rectifier (.1)
Potri.012G043000
47 / 2e-06
AT3G02850 1032 / 0.0
STELAR K+ outward rectifier, STELAR K+ outward rectifier (.1)
PFAM info
Representative CDS sequence
>Lus10003645 pacid=23145343 polypeptide=Lus10003645 locus=Lus10003645.g ID=Lus10003645.BGIv1.0 annot-version=v1.0
ATGGGAGCCCAAATTAATGATGATTTTGATCATGATGAGGAGGAAGAGGTATCATTATCAATATCATCACCATCATCGTCAGCTCACTTCGTTCATGACT
TGTCCAAGATTGTTCTTCCACCTTTAGGTATCTCAACTCAAGTCCATGCTCCACGGAGATCAAGAGGGGGCATCATTTCTCCCCTCGATTCAAGATACAG
ATGTTGGGAGGCATTAATGGTGATGTTGGCAGCTTATTCAGTGTGGTTCTATCCTTTTGAGTTAGCATTCCTAGATCCCTCACATCACAAGGAGCTCTAC
TTGTTGGACGTTACAACAGATGTGTTCTTTGCCTTTGACATCCTTCTCACCTTCTTCCTTGCTTACATCGACTCCAAGACCAATTTCATTGTTTATGATC
CAACAAGAATTGCTAAGAGGTATAAACTAGACCTAATTCCCTATTTCATTTCATGTATTCCACATCGCATTCATCTGCATGCTCGATGA
AA sequence
>Lus10003645 pacid=23145343 polypeptide=Lus10003645 locus=Lus10003645.g ID=Lus10003645.BGIv1.0 annot-version=v1.0
MGAQINDDFDHDEEEEVSLSISSPSSSAHFVHDLSKIVLPPLGISTQVHAPRRSRGGIISPLDSRYRCWEALMVMLAAYSVWFYPFELAFLDPSHHKELY
LLDVTTDVFFAFDILLTFFLAYIDSKTNFIVYDPTRIAKRYKLDLIPYFISCIPHRIHLHAR
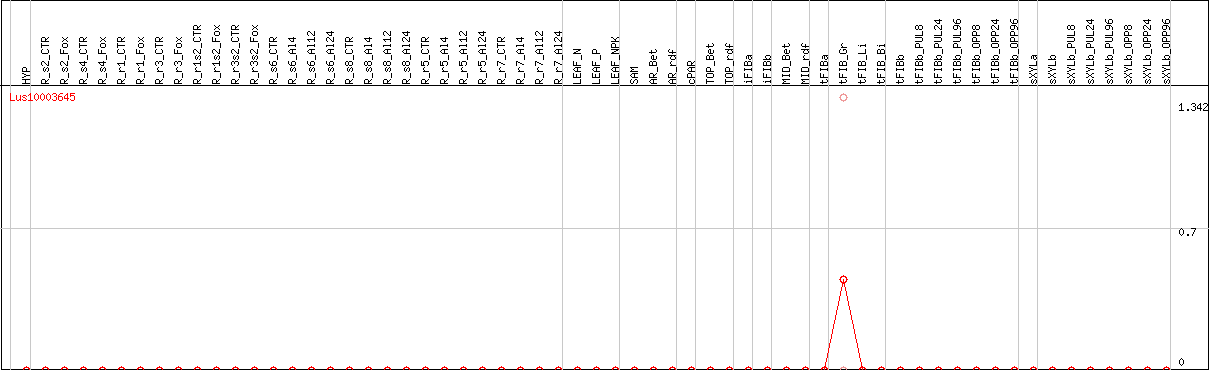
DESeq2's median of ratios [FLAX]
Coexpressed genes
Lus10003645 coexpression network
*The number of genes in the network is adjusted within 50 genes.
*Gene name represents symbol(s) of closest Arabidopsis gene if symbol(s) for the gene itself doesn't exist.
*Circle diameter represents the number of connection with other genes within this network.
*Color for gene name represents subnetwork based on the result of network clustering.