External link
Symbol
Arabidopsis homologues
Locus ID
BLAST score/e-value
TF class
Alias
TAIR10 short description
AT2G02390 72 / 2e-17
GST18, ATGSTZ1
GLUTATHIONE S-TRANSFERASE 18, glutathione S-transferase zeta 1 (.1.2.3)
AT2G02380 68 / 6e-16
ATGSTZ2
glutathione S-transferase (class zeta) 2 (.1)
AT2G29490 40 / 2e-05
GST19, ATGSTU1
GLUTATHIONE S-TRANSFERASE 19, glutathione S-transferase TAU 1 (.1)
AT2G29480 40 / 2e-05
GST20, ATGSTU2
GLUTATHIONE S-TRANSFERASE 20, glutathione S-transferase tau 2 (.1)
AT2G29460 38 / 0.0001
GST22, ATGSTU4
GLUTATHIONE S-TRANSFERASE 22, glutathione S-transferase tau 4 (.1)
AT2G29440 38 / 0.0001
GST24, ATGSTU6
GLUTATHIONE S-TRANSFERASE 24, glutathione S-transferase tau 6 (.1)
AT1G74590 37 / 0.0001
ATGSTU10
glutathione S-transferase TAU 10 (.1)
AT2G29450 37 / 0.0001
ATGSTU1, AT103-1A, ATGSTU5
ARABIDOPSIS THALIANA GLUTATHIONE S-TRANSFERASE TAU 1, glutathione S-transferase tau 5 (.1)
AT2G29470 37 / 0.0002
GST21, ATGSTU3
GLUTATHIONE S-TRANSFERASE 21, glutathione S-transferase tau 3 (.1)
AT1G59670 37 / 0.0002
ATGSTU15
glutathione S-transferase TAU 15 (.1)
Paralogs
Gene ID
BLAST score/e-value
At best hit
BLAST score/e-value
TAIR10 short description
Lus10005367
108 / 1e-31
AT2G02390 284 / 4e-98
GLUTATHIONE S-TRANSFERASE 18, glutathione S-transferase zeta 1 (.1.2.3)
Lus10020519
101 / 1e-28
AT2G02390 283 / 2e-97
GLUTATHIONE S-TRANSFERASE 18, glutathione S-transferase zeta 1 (.1.2.3)
Lus10030274
64 / 3e-14
AT2G02390 249 / 6e-84
GLUTATHIONE S-TRANSFERASE 18, glutathione S-transferase zeta 1 (.1.2.3)
Lus10017208
44 / 7e-07
AT3G09270 212 / 3e-69
glutathione S-transferase TAU 8 (.1)
Lus10016470
42 / 4e-06
AT2G29420 166 / 6e-52
GLUTATHIONE S-TRANSFERASE 25, glutathione S-transferase tau 7 (.1)
Lus10035241
42 / 5e-06
AT2G29420 188 / 5e-60
GLUTATHIONE S-TRANSFERASE 25, glutathione S-transferase tau 7 (.1)
Lus10021102
41 / 8e-06
AT3G09270 245 / 2e-82
glutathione S-transferase TAU 8 (.1)
Lus10016471
39 / 5e-05
AT2G29420 234 / 8e-78
GLUTATHIONE S-TRANSFERASE 25, glutathione S-transferase tau 7 (.1)
Lus10004026
39 / 6e-05
AT2G02390 143 / 6e-44
GLUTATHIONE S-TRANSFERASE 18, glutathione S-transferase zeta 1 (.1.2.3)
Locus ID
BLAST score/e-value
At best hit
BLAST score/e-value
TAIR10 short description
Potri.004G232600
76 / 7e-19
AT2G02390 306 / 2e-106
GLUTATHIONE S-TRANSFERASE 18, glutathione S-transferase zeta 1 (.1.2.3)
Potri.014G069600
50 / 5e-09
AT2G02390 204 / 1e-66
GLUTATHIONE S-TRANSFERASE 18, glutathione S-transferase zeta 1 (.1.2.3)
Potri.016G118500
45 / 4e-07
AT2G29420 194 / 3e-62
GLUTATHIONE S-TRANSFERASE 25, glutathione S-transferase tau 7 (.1)
Potri.010G061600
41 / 7e-06
AT2G29420 172 / 7e-54
GLUTATHIONE S-TRANSFERASE 25, glutathione S-transferase tau 7 (.1)
Potri.010G061301
41 / 7e-06
AT2G29420 202 / 9e-66
GLUTATHIONE S-TRANSFERASE 25, glutathione S-transferase tau 7 (.1)
Potri.010G061800
41 / 9e-06
AT2G29420 187 / 1e-59
GLUTATHIONE S-TRANSFERASE 25, glutathione S-transferase tau 7 (.1)
Potri.005G037801
38 / 6e-05
AT1G78340 197 / 7e-65
glutathione S-transferase TAU 22 (.1)
Potri.011G140750
37 / 6e-05
AT1G17170 122 / 2e-36
Arabidopsis thaliana Glutathione S-transferase \(class tau\) 24, glutathione S-transferase TAU 24 (.1)
Potri.008G174900
38 / 9e-05
AT2G29420 184 / 1e-58
GLUTATHIONE S-TRANSFERASE 25, glutathione S-transferase tau 7 (.1)
Potri.001G437200
38 / 0.0001
AT1G78380 308 / 2e-107
GLUTATHIONE TRANSFERASE 8, A. THALIANA GLUTATHIONE S-TRANSFERASE TAU 19, glutathione S-transferase TAU 19 (.1)
PFAM info
Clan ID
Clan name
Pfam ID
Pfam name
Pfam description
CL0172
Thioredoxin
PF02798
GST_N
Glutathione S-transferase, N-terminal domain
Representative CDS sequence
>Lus10005368 pacid=23148520 polypeptide=Lus10005368 locus=Lus10005368.g ID=Lus10005368.BGIv1.0 annot-version=v1.0
ATGGCATCGAGCGGCGATCATCATGATCGGATCAAGCTCTACTCTTACTGGCGGAGCTCTTGCTCTTGCCGCGTCCGAATTGCTCTCAAGCTCAAAGGGA
TTAAGTACGACTATGTTCCCGTTGACTTGGTCAAAGGGGAGCAATCCAGTCCCGGTGAGTACCATCTTGTGCTCATGCAATGA
AA sequence
>Lus10005368 pacid=23148520 polypeptide=Lus10005368 locus=Lus10005368.g ID=Lus10005368.BGIv1.0 annot-version=v1.0
MASSGDHHDRIKLYSYWRSSCSCRVRIALKLKGIKYDYVPVDLVKGEQSSPGEYHLVLMQ
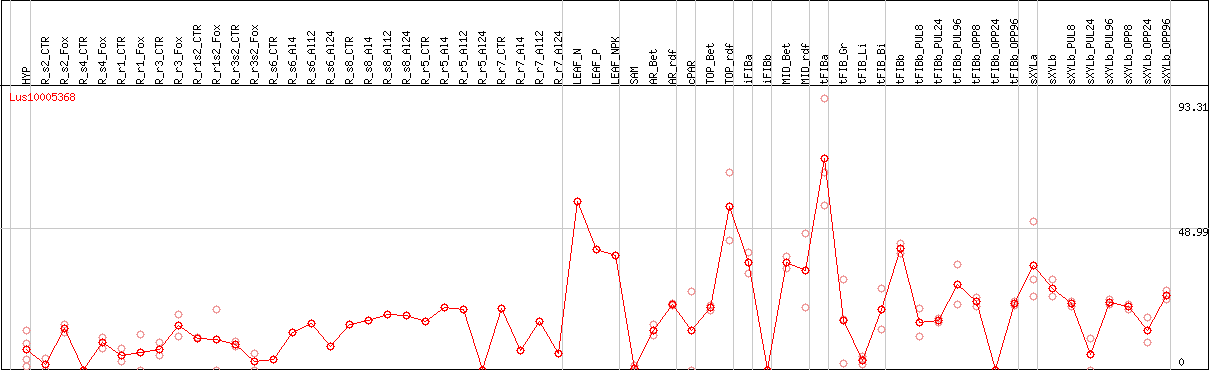
DESeq2's median of ratios [FLAX]
Coexpressed genes
Lus10005368 coexpression network
*The number of genes in the network is adjusted within 50 genes.
*Gene name represents symbol(s) of closest Arabidopsis gene if symbol(s) for the gene itself doesn't exist.
*Circle diameter represents the number of connection with other genes within this network.
*Color for gene name represents subnetwork based on the result of network clustering.