External link
Symbol
Arabidopsis homologues
No hit found
Paralogs
Gene ID
BLAST score/e-value
At best hit
BLAST score/e-value
TAIR10 short description
Lus10000121
44 / 2e-06
AT5G17680 277 / 1e-82
disease resistance protein (TIR-NBS-LRR class), putative (.1)
Lus10026201
44 / 2e-06
AT5G17680 511 / 1e-160
disease resistance protein (TIR-NBS-LRR class), putative (.1)
Lus10029722
41 / 2e-05
AT5G17680 608 / 0.0
disease resistance protein (TIR-NBS-LRR class), putative (.1)
Lus10042465
41 / 2e-05
AT5G46490 151 / 3e-40
Disease resistance protein (TIR-NBS-LRR class) family (.1), Disease resistance protein (TIR-NBS-LRR class) family (.2)
Lus10005171
40 / 3e-05
AT1G27170 576 / 0.0
transmembrane receptors;ATP binding (.1.2)
Lus10028042
40 / 6e-05
AT5G17680 145 / 2e-38
disease resistance protein (TIR-NBS-LRR class), putative (.1)
Lus10011741
39 / 8e-05
AT5G36930 540 / 4e-172
Disease resistance protein (TIR-NBS-LRR class) family (.1), Disease resistance protein (TIR-NBS-LRR class) family (.2)
Lus10038249
38 / 0.0002
AT5G17680 445 / 4e-137
disease resistance protein (TIR-NBS-LRR class), putative (.1)
Lus10005588
37 / 0.0004
AT5G17680 499 / 2e-156
disease resistance protein (TIR-NBS-LRR class), putative (.1)
Locus ID
BLAST score/e-value
At best hit
BLAST score/e-value
TAIR10 short description
Potri.019G069200
46 / 4e-07
AT5G17680 590 / 0.0
disease resistance protein (TIR-NBS-LRR class), putative (.1)
Potri.017G010800
44 / 1e-06
AT5G17680 592 / 0.0
disease resistance protein (TIR-NBS-LRR class), putative (.1)
Potri.002G056100
42 / 6e-06
AT5G36930 591 / 0.0
Disease resistance protein (TIR-NBS-LRR class) family (.1), Disease resistance protein (TIR-NBS-LRR class) family (.2)
Potri.019G068300
41 / 2e-05
AT5G17680 580 / 0.0
disease resistance protein (TIR-NBS-LRR class), putative (.1)
Potri.019G070001
40 / 3e-05
AT5G17680 481 / 5e-148
disease resistance protein (TIR-NBS-LRR class), putative (.1)
Potri.019G070565
40 / 3e-05
AT5G17680 482 / 3e-148
disease resistance protein (TIR-NBS-LRR class), putative (.1)
Potri.005G031899
40 / 3e-05
AT1G69550 469 / 6e-141
disease resistance protein (TIR-NBS-LRR class) (.1)
Potri.019G070300
40 / 4e-05
AT5G17680 558 / 0.0
disease resistance protein (TIR-NBS-LRR class), putative (.1)
Potri.013G037599
40 / 4e-05
AT5G36930 627 / 0.0
Disease resistance protein (TIR-NBS-LRR class) family (.1), Disease resistance protein (TIR-NBS-LRR class) family (.2)
Potri.001G066500
39 / 6e-05
AT5G36930 462 / 2e-146
Disease resistance protein (TIR-NBS-LRR class) family (.1), Disease resistance protein (TIR-NBS-LRR class) family (.2)
PFAM info
Representative CDS sequence
>Lus10007903 pacid=23143213 polypeptide=Lus10007903 locus=Lus10007903.g ID=Lus10007903.BGIv1.0 annot-version=v1.0
ATGACAGTTTGGATCATGAGGAGCAGAGTGTGTTTCTGGACATTGCTTCCTTCTTCCGAGCAGAGTTTGGATCATGTTGGATGCTTGGCAACGGTTTCTA
GCAGCAAGACTTTGGAAATGCATGATTTGGTTCAAGAACTGGGTTGGGGCATTGTGCATCAGGAGCTGGAGCCTGGACAACGTGCCATGGTGTGGACTCG
TAAGGATATTTTCCGAATCTATGTCGGATGA
AA sequence
>Lus10007903 pacid=23143213 polypeptide=Lus10007903 locus=Lus10007903.g ID=Lus10007903.BGIv1.0 annot-version=v1.0
MTVWIMRSRVCFWTLLPSSEQSLDHVGCLATVSSSKTLEMHDLVQELGWGIVHQELEPGQRAMVWTRKDIFRIYVG
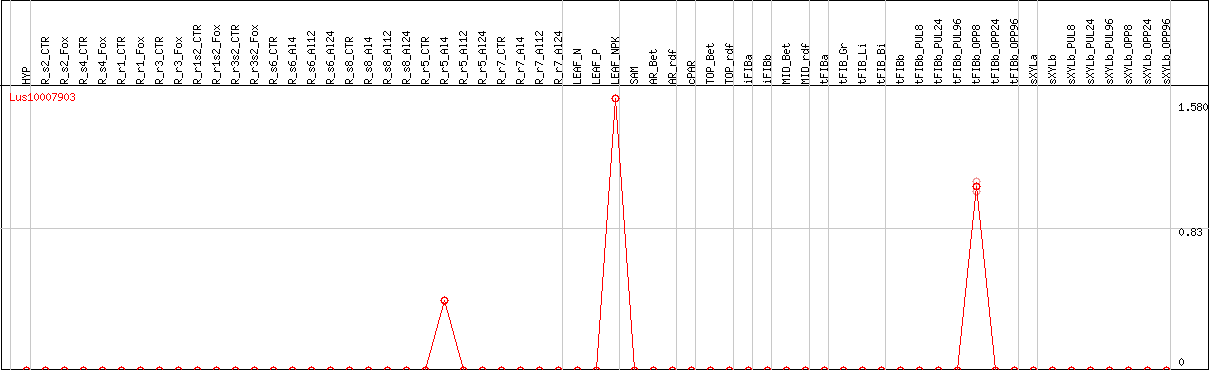
DESeq2's median of ratios [FLAX]
Coexpressed genes
Lus10007903 coexpression network
*The number of genes in the network is adjusted within 50 genes.
*Gene name represents symbol(s) of closest Arabidopsis gene if symbol(s) for the gene itself doesn't exist.
*Circle diameter represents the number of connection with other genes within this network.
*Color for gene name represents subnetwork based on the result of network clustering.