Lus10023474 [FLAX]


External link
JGI Phytozome v13
Symbol
Arabidopsis homologues
Locus ID BLAST score/e-value TF class Alias TAIR10 short description
AT1G76810 223 / 2e-68 eukaryotic translation initiation factor 2 (eIF-2) family protein (.1)
AT1G76720 216 / 4e-66 eukaryotic translation initiation factor 2 (eIF-2) family protein (.1)
AT1G76820 214 / 1e-65 eukaryotic translation initiation factor 2 (eIF-2) family protein (.1)
AT1G21160 206 / 1e-62 eukaryotic translation initiation factor 2 (eIF-2) family protein (.1)
AT2G27700 173 / 3e-53 eukaryotic translation initiation factor 2 family protein / eIF-2 family protein (.1.2)
AT4G11160 86 / 2e-20 Translation initiation factor 2, small GTP-binding protein (.1)
AT1G17220 78 / 8e-18 FUG1 fu-gaeri1, Translation initiation factor 2, small GTP-binding protein (.1)
AT5G08650 45 / 2e-06 Small GTP-binding protein (.1)
AT5G39900 43 / 1e-05 Small GTP-binding protein (.1)
Paralogs
Gene ID BLAST score/e-value At best hit BLAST score/e-value TAIR10 short description
Lus10012856 225 / 3e-69 AT1G76820 1211 / 0.0 eukaryotic translation initiation factor 2 (eIF-2) family protein (.1)
Lus10030500 224 / 5e-69 AT1G76810 1217 / 0.0 eukaryotic translation initiation factor 2 (eIF-2) family protein (.1)
Lus10005581 86 / 2e-20 AT1G17220 1080 / 0.0 fu-gaeri1, Translation initiation factor 2, small GTP-binding protein (.1)
Lus10013713 82 / 4e-19 AT1G17220 1267 / 0.0 fu-gaeri1, Translation initiation factor 2, small GTP-binding protein (.1)
Lus10033933 72 / 1e-15 AT4G11160 927 / 0.0 Translation initiation factor 2, small GTP-binding protein (.1)
Lus10040356 52 / 2e-09 AT1G76810 56 / 2e-10 eukaryotic translation initiation factor 2 (eIF-2) family protein (.1)
Lus10025694 45 / 3e-06 AT5G08650 1009 / 0.0 Small GTP-binding protein (.1)
Lus10035968 45 / 4e-06 AT5G08650 1102 / 0.0 Small GTP-binding protein (.1)
Lus10007250 45 / 4e-06 AT5G39900 1080 / 0.0 Small GTP-binding protein (.1)
Poplar homologues
Locus ID BLAST score/e-value At best hit BLAST score/e-value TAIR10 short description
Potri.012G039200 224 / 6e-69 AT1G76810 1096 / 0.0 eukaryotic translation initiation factor 2 (eIF-2) family protein (.1)
Potri.019G103600 201 / 8e-61 AT1G76810 976 / 0.0 eukaryotic translation initiation factor 2 (eIF-2) family protein (.1)
Potri.001G095500 82 / 3e-19 AT4G11160 828 / 0.0 Translation initiation factor 2, small GTP-binding protein (.1)
Potri.001G436300 78 / 8e-18 AT1G17220 1076 / 0.0 fu-gaeri1, Translation initiation factor 2, small GTP-binding protein (.1)
Potri.011G140100 77 / 2e-17 AT1G17220 1160 / 0.0 fu-gaeri1, Translation initiation factor 2, small GTP-binding protein (.1)
Potri.011G132300 58 / 5e-11 AT1G76820 145 / 5e-40 eukaryotic translation initiation factor 2 (eIF-2) family protein (.1)
Potri.011G132100 58 / 5e-11 AT1G76820 145 / 5e-40 eukaryotic translation initiation factor 2 (eIF-2) family protein (.1)
Potri.017G079800 49 / 2e-07 AT5G39900 999 / 0.0 Small GTP-binding protein (.1)
Potri.001G305300 45 / 4e-06 AT5G08650 1063 / 0.0 Small GTP-binding protein (.1)
Potri.014G138100 38 / 0.001 AT4G02930 752 / 0.0 GTP binding Elongation factor Tu family protein (.1)
PFAM info
Clan ID Clan name Pfam ID Pfam name Pfam description
CL0023 P-loop_NTPase PF00009 GTP_EFTU Elongation factor Tu GTP binding domain
Representative CDS sequence
>Lus10023474 pacid=23160590 polypeptide=Lus10023474 locus=Lus10023474.g ID=Lus10023474.BGIv1.0 annot-version=v1.0
ATGGGGCATGTGGAAACGGGCAAGACGACGCTTCTGGATTGTATTAGAGGAAGCAATGTGCAGGAAGGTGAGGCAGGGGGTATCACGCAGCAAAGCGGTG
CGACGTACTTTCCTTCCGAGAACATAAGAGAGCAAACTAAAGAATTGAAGGATGACGCGAAGCTGAAGGTTCCTGGTTTGTTGGTTATTGACACCCCTGG
CCACGAATCGATAACCGAACTTCGTTCGAGAGGGTCGGGGTTATGTGATATTTCTGTTTTGGTTGTTGATATCATGCATGGGTTGGAGCCGCAGACGGTA
GAGTCTCTCAATCTGTTGAGAATGAGGAACAACGAATTCATCGTTGCCTTAAATAAGGTACGTGATCTGTAA
AA sequence
>Lus10023474 pacid=23160590 polypeptide=Lus10023474 locus=Lus10023474.g ID=Lus10023474.BGIv1.0 annot-version=v1.0
MGHVETGKTTLLDCIRGSNVQEGEAGGITQQSGATYFPSENIREQTKELKDDAKLKVPGLLVIDTPGHESITELRSRGSGLCDISVLVVDIMHGLEPQTV
ESLNLLRMRNNEFIVALNKVRDL

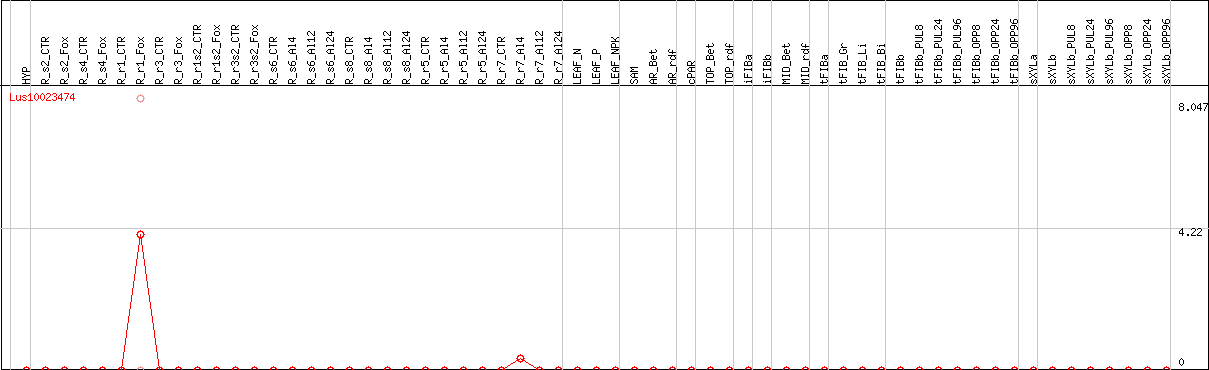
DESeq2's median of ratios [FLAX]

Order by: Show schematic diagram

Coexpressed genes

Only top 10 genes are shown Show allDownload tab-delimited text
Schematic diagram [FLAX] Schematic diagram [POPLAR]

*If you select 4 or less genes and then press "compare expression", expression will be shown as a graph. If you select more than 4 genes, expresion will be shown as a heat map.
*Color represents relative expression level among samples for each gene.
At best At TF class At alias At description Locus MR r Symbol HYPR_s2_CTRR_s2_FoxR_s4_CTRR_s4_FoxR_r1_CTRR_r1_FoxR_r3_CTRR_r3_FoxR_r1s2_CTRR_r1s2_FoxR_r3s2_CTRR_r3s2_FoxR_s6_CTRR_s6_Al4R_s6_Al12R_s6_Al24R_s8_CTRR_s8_Al4R_s8_Al12R_s8_Al24R_r5_CTRR_r5_Al4R_r5_Al12R_r5_Al24R_r7_CTRR_r7_Al4R_r7_Al12R_r7_Al24LEAF_NLEAF_PLEAF_NPKSAMAR_BetAR_rdfcPARTOP_BetTOP_rdfiFIBaiFIBbMID_BetMID_rdftFIBatFIB_GrtFIB_LitFIB_BitFIBbtFIBb_PUL8tFIBb_PUL24tFIBb_PUL96tFIBb_OPP8tFIBb_OPP24tFIBb_OPP96sXYLasXYLbsXYLb_PUL8sXYLb_PUL24sXYLb_PUL96sXYLb_OPP8sXYLb_OPP24sXYLb_OPP96
AT1G76810 eukaryotic translation initiat... Lus10023474 0 1
AT4G10850 SWEET7, AtSWEET... Nodulin MtN3 family protein (.... Lus10023047 2.6 0.9962
AT5G12060 Plant self-incompatibility pro... Lus10023195 3.7 0.9962
AT5G17600 RING/U-box superfamily protein... Lus10008458 4.6 0.9962
AT4G35610 C2H2ZnF zinc finger (C2H2 type) family... Lus10035994 5.3 0.9947
AT5G07480 KUOX1 KAR-UP oxidoreductase 1 (.1) Lus10043000 5.9 0.9947
AT3G08710 TRXH9, ATH9 THIOREDOXIN TYPE H 9, thioredo... Lus10030505 6.5 0.9939
AT3G62770 ATATG18A autophagy 18a, Transducin/WD40... Lus10023022 7.0 0.9925
AT1G04110 SDD1 STOMATAL DENSITY AND DISTRIBUT... Lus10007046 7.7 0.7402
AT5G02930 F-box/RNI-like superfamily pro... Lus10040452 7.9 0.8912
AT5G54010 UDP-Glycosyltransferase superf... Lus10008453 8.0 0.9921

Lus10023474 coexpression network

*The number of genes in the network is adjusted within 50 genes.
*Gene name represents symbol(s) of closest Arabidopsis gene if symbol(s) for the gene itself doesn't exist.
*Circle diameter represents the number of connection with other genes within this network.
*Color for gene name represents subnetwork based on the result of network clustering.