External link
Symbol
Arabidopsis homologues
Locus ID
BLAST score/e-value
TF class
Alias
TAIR10 short description
AT3G12390 205 / 2e-68
Nascent polypeptide-associated complex (NAC), alpha subunit family protein (.1)
AT5G13850 191 / 4e-63
NACA3
nascent polypeptide-associated complex subunit alpha-like protein 3 (.1)
AT4G10480 187 / 1e-61
Nascent polypeptide-associated complex (NAC), alpha subunit family protein (.1), Nascent polypeptide-associated complex (NAC), alpha subunit family protein (.2)
AT3G49470 181 / 8e-59
NACA2
nascent polypeptide-associated complex subunit alpha-like protein 2 (.1)
AT1G33040 172 / 2e-55
NACA5
nascent polypeptide-associated complex subunit alpha-like protein 5 (.1)
Paralogs
Gene ID
BLAST score/e-value
At best hit
BLAST score/e-value
TAIR10 short description
Lus10008687
245 / 1e-81
AT3G15660 197 / 7e-62
A. THALIANA GLUTAREDOXIN 4, glutaredoxin 4 (.1.2)
Lus10041610
232 / 3e-79
AT3G12390 229 / 7e-77
Nascent polypeptide-associated complex (NAC), alpha subunit family protein (.1)
Lus10024109
229 / 6e-79
AT3G12390 198 / 1e-65
Nascent polypeptide-associated complex (NAC), alpha subunit family protein (.1)
Lus10032927
179 / 4e-58
AT3G49470 260 / 2e-88
nascent polypeptide-associated complex subunit alpha-like protein 2 (.1)
Lus10015579
179 / 4e-58
AT3G49470 260 / 1e-88
nascent polypeptide-associated complex subunit alpha-like protein 2 (.1)
Locus ID
BLAST score/e-value
At best hit
BLAST score/e-value
TAIR10 short description
Potri.001G034400
239 / 4e-82
AT3G12390 204 / 5e-67
Nascent polypeptide-associated complex (NAC), alpha subunit family protein (.1)
Potri.003G190800
239 / 6e-82
AT3G12390 204 / 7e-67
Nascent polypeptide-associated complex (NAC), alpha subunit family protein (.1)
Potri.006G032000
221 / 1e-74
AT3G12390 215 / 2e-71
Nascent polypeptide-associated complex (NAC), alpha subunit family protein (.1)
Potri.015G003300
186 / 7e-61
AT3G49470 172 / 4e-54
nascent polypeptide-associated complex subunit alpha-like protein 2 (.1)
Potri.012G006700
172 / 2e-55
AT3G49470 171 / 1e-53
nascent polypeptide-associated complex subunit alpha-like protein 2 (.1)
PFAM info
Clan ID
Clan name
Pfam ID
Pfam name
Pfam description
PF01849
NAC
NAC domain
CL0214
UBA
PF00627
UBA
UBA/TS-N domain
Representative CDS sequence
>Lus10026133 pacid=23173149 polypeptide=Lus10026133 locus=Lus10026133.g ID=Lus10026133.BGIv1.0 annot-version=v1.0
ATGTTGAAGTTGGGAATGAAGCCCATGACCGGCGTCAGTCGAGTTACTGTCAAGAAGAGCAAGAATATCTTGTTCGTGATCTCAAAACCGGACGTGTTCA
AGAGCCCAACATCGGACACATACATCATCTTCGGAGAGGCCAAGATCGAAGACATCAGCTCGCAGCTACAAAGCCAAGCAGCAGAGCAGTTCAAGGCCCC
TGATCTGAGCCATATGATCTCGAAACCAGAGACCTCTGGCATGGCTCAGGACAATGAGGAGGTGGATGAAACTGGAGTCGAATCAAAGGACATTGAATTA
GTTATGACACAGGCGGGAGTCTCGAGGCCTAAAGCCGTGAGGGCTCTCAAGGCTGCAGATGGGGACATTGTATCTGCAATCATGGAACTTACCACCTGA
AA sequence
>Lus10026133 pacid=23173149 polypeptide=Lus10026133 locus=Lus10026133.g ID=Lus10026133.BGIv1.0 annot-version=v1.0
MLKLGMKPMTGVSRVTVKKSKNILFVISKPDVFKSPTSDTYIIFGEAKIEDISSQLQSQAAEQFKAPDLSHMISKPETSGMAQDNEEVDETGVESKDIEL
VMTQAGVSRPKAVRALKAADGDIVSAIMELTT
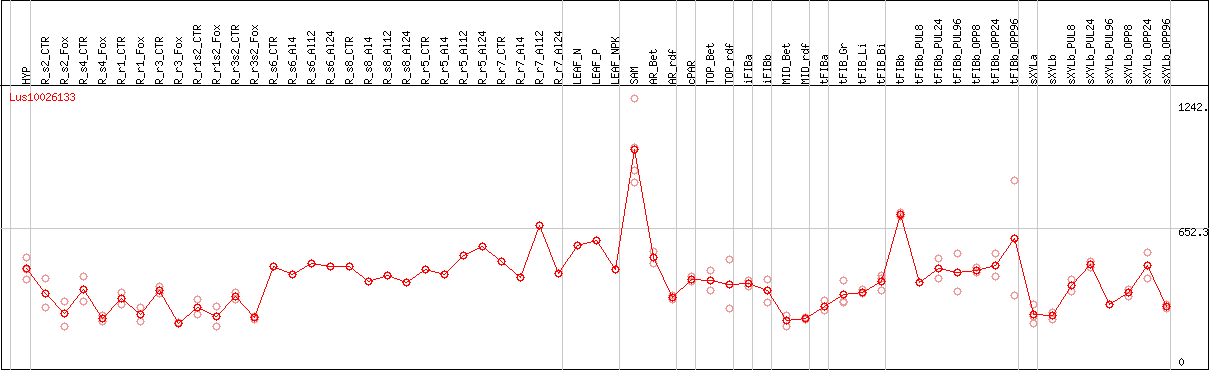
DESeq2's median of ratios [FLAX]
Coexpressed genes
Lus10026133 coexpression network
*The number of genes in the network is adjusted within 50 genes.
*Gene name represents symbol(s) of closest Arabidopsis gene if symbol(s) for the gene itself doesn't exist.
*Circle diameter represents the number of connection with other genes within this network.
*Color for gene name represents subnetwork based on the result of network clustering.