External link
Symbol
Arabidopsis homologues
Locus ID
BLAST score/e-value
TF class
Alias
TAIR10 short description
AT3G57240 185 / 4e-58
BG3
"beta-1,3-glucanase 3", beta-1,3-glucanase 3 (.1)
AT3G57270 184 / 8e-58
BG1
"beta-1,3-glucanase 1", beta-1,3-glucanase 1 (.1)
AT3G57260 180 / 2e-56
AtPR2, PR-2, PR2, BG2, BGL2
PATHOGENESIS-RELATED PROTEIN 2, "beta-1,3-glucanase 2", beta-1,3-glucanase 2 (.1)
AT4G16260 179 / 1e-55
Glycosyl hydrolase superfamily protein (.1)
AT5G56590 154 / 5e-45
O-Glycosyl hydrolases family 17 protein (.1)
AT2G27500 137 / 9e-40
Glycosyl hydrolase superfamily protein (.1.2.3)
AT1G77780 135 / 8e-39
Glycosyl hydrolase superfamily protein (.1)
AT2G01630 135 / 1e-38
O-Glycosyl hydrolases family 17 protein (.1.2)
AT5G20340 134 / 2e-38
BG5
beta-1,3-glucanase 5 (.1)
AT5G20390 134 / 3e-38
Glycosyl hydrolase superfamily protein (.1)
Paralogs
Gene ID
BLAST score/e-value
At best hit
BLAST score/e-value
TAIR10 short description
Lus10002807
343 / 3e-120
AT3G57240 339 / 7e-116
"beta-1,3-glucanase 3", beta-1,3-glucanase 3 (.1)
Lus10027860
271 / 1e-91
AT3G57260 322 / 4e-109
PATHOGENESIS-RELATED PROTEIN 2, "beta-1,3-glucanase 2", beta-1,3-glucanase 2 (.1)
Lus10014108
224 / 7e-71
AT3G57270 366 / 3e-123
"beta-1,3-glucanase 1", beta-1,3-glucanase 1 (.1)
Lus10019801
216 / 3e-70
AT3G57270 367 / 6e-127
"beta-1,3-glucanase 1", beta-1,3-glucanase 1 (.1)
Lus10014109
211 / 3e-68
AT3G57270 361 / 1e-124
"beta-1,3-glucanase 1", beta-1,3-glucanase 1 (.1)
Lus10014110
196 / 1e-62
AT3G57270 359 / 2e-124
"beta-1,3-glucanase 1", beta-1,3-glucanase 1 (.1)
Lus10019800
189 / 4e-61
AT3G57270 238 / 1e-77
"beta-1,3-glucanase 1", beta-1,3-glucanase 1 (.1)
Lus10016883
191 / 1e-60
AT4G16260 391 / 1e-136
Glycosyl hydrolase superfamily protein (.1)
Lus10031037
164 / 5e-50
AT3G57240 312 / 3e-105
"beta-1,3-glucanase 3", beta-1,3-glucanase 3 (.1)
Locus ID
BLAST score/e-value
At best hit
BLAST score/e-value
TAIR10 short description
Potri.006G046100
206 / 3e-66
AT3G57270 370 / 4e-128
"beta-1,3-glucanase 1", beta-1,3-glucanase 1 (.1)
Potri.016G057400
202 / 8e-65
AT3G57270 416 / 4e-146
"beta-1,3-glucanase 1", beta-1,3-glucanase 1 (.1)
Potri.006G048100
193 / 2e-61
AT3G57270 382 / 6e-133
"beta-1,3-glucanase 1", beta-1,3-glucanase 1 (.1)
Potri.016G057600
191 / 1e-60
AT3G57270 414 / 2e-145
"beta-1,3-glucanase 1", beta-1,3-glucanase 1 (.1)
Potri.010G143166
188 / 2e-59
AT4G16260 432 / 5e-153
Glycosyl hydrolase superfamily protein (.1)
Potri.001G255100
187 / 4e-59
AT4G16260 369 / 9e-128
Glycosyl hydrolase superfamily protein (.1)
Potri.010G142800
184 / 1e-57
AT4G16260 433 / 2e-152
Glycosyl hydrolase superfamily protein (.1)
Potri.009G050401
158 / 1e-48
AT4G16260 263 / 2e-87
Glycosyl hydrolase superfamily protein (.1)
Potri.009G050300
159 / 2e-48
AT4G16260 285 / 5e-95
Glycosyl hydrolase superfamily protein (.1)
Potri.002G089200
147 / 1e-43
AT1G77780 309 / 6e-104
Glycosyl hydrolase superfamily protein (.1)
PFAM info
Clan ID
Clan name
Pfam ID
Pfam name
Pfam description
CL0058
Glyco_hydro_tim
PF00332
Glyco_hydro_17
Glycosyl hydrolases family 17
Representative CDS sequence
>Lus10027859 pacid=23156927 polypeptide=Lus10027859 locus=Lus10027859.g ID=Lus10027859.BGIv1.0 annot-version=v1.0
ATGGGCAATACATACCCGCCGGACCAAGGCGCTTTCAACCAAGCTTATATGGGCCTTCTAAGGCCCATATTGGACTTTTTAGCGGCCAATCAATCCCCGA
TGCTATTAAACTTGTACCCGTTTTTCAGCCACCGTGACAACCCGGTTCAAGTGCTACTTAACTATGCTCTATTCAGAGGTCCGCCCGACCAAGGAACCGG
GTACGAAAACCTTTTCTTTGCAATGTTGGATTCCACGTACTATGCCCTGGAACGAGAAGGAAAGGAGAGTCTGAACATCGTAGTGTCGGAGAGCGGGTGG
CCGTCGGCAGGAGGAGGGGCTCCGACAACAGTGGATAATGCAAGGACTTACAACAACAATTTGGTACAACAGGTTAAAAGAGGGACACCAAAGCGTCCCG
GTAGACCAATTGAGACGTATATTTTCGCAATGTTTGACGAAGGGGACAAGGGTGGGGAACCGCTGGAGAAACATTTTGGGCTGTTTAGTCCTAATAGGCA
GCCAAAGTATCCGATGAGGTTCGACTAA
AA sequence
>Lus10027859 pacid=23156927 polypeptide=Lus10027859 locus=Lus10027859.g ID=Lus10027859.BGIv1.0 annot-version=v1.0
MGNTYPPDQGAFNQAYMGLLRPILDFLAANQSPMLLNLYPFFSHRDNPVQVLLNYALFRGPPDQGTGYENLFFAMLDSTYYALEREGKESLNIVVSESGW
PSAGGGAPTTVDNARTYNNNLVQQVKRGTPKRPGRPIETYIFAMFDEGDKGGEPLEKHFGLFSPNRQPKYPMRFD
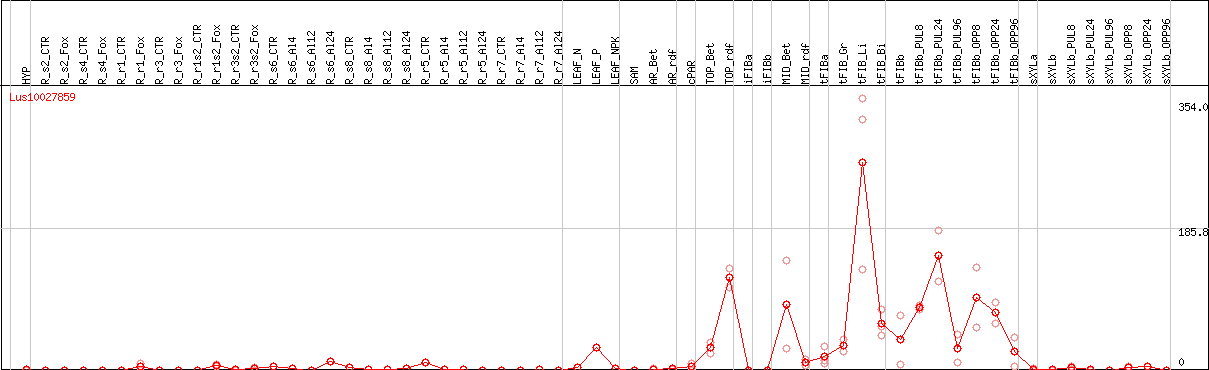
DESeq2's median of ratios [FLAX]
Coexpressed genes
Lus10027859 coexpression network
*The number of genes in the network is adjusted within 50 genes.
*Gene name represents symbol(s) of closest Arabidopsis gene if symbol(s) for the gene itself doesn't exist.
*Circle diameter represents the number of connection with other genes within this network.
*Color for gene name represents subnetwork based on the result of network clustering.