External link
Symbol
Arabidopsis homologues
Locus ID
BLAST score/e-value
TF class
Alias
TAIR10 short description
AT3G50310 94 / 3e-23
MKKK20, MAPKKK20
MAPKK kinase 20, mitogen-activated protein kinase kinase kinase 20 (.1)
AT5G67080 92 / 1e-22
MAPKKK19
mitogen-activated protein kinase kinase kinase 19 (.1)
AT4G36950 86 / 1e-20
MAPKKK21
mitogen-activated protein kinase kinase kinase 21 (.1)
AT3G46140 86 / 5e-20
Protein kinase superfamily protein (.1)
AT5G55090 84 / 2e-19
MAPKKK15
mitogen-activated protein kinase kinase kinase 15 (.1)
AT3G06030 83 / 7e-19
AtANP3, MAPKKK12, ANP3
NPK1-related protein kinase 3 (.1)
AT4G26890 82 / 1e-18
MAPKKK16
mitogen-activated protein kinase kinase kinase 16 (.1)
AT2G32510 82 / 1e-18
MAPKKK17
mitogen-activated protein kinase kinase kinase 17 (.1)
AT2G42550 81 / 2e-18
Protein kinase superfamily protein (.1)
AT1G09000 80 / 7e-18
MAPKKK1, ANP1
MAP KINASE KINASE KINASE 1, NPK1-related protein kinase 1 (.1)
Paralogs
Gene ID
BLAST score/e-value
At best hit
BLAST score/e-value
TAIR10 short description
Lus10034217
194 / 4e-65
AT5G67080 60 / 2e-11
mitogen-activated protein kinase kinase kinase 19 (.1)
Lus10026894
157 / 2e-48
AT3G50310 187 / 1e-57
MAPKK kinase 20, mitogen-activated protein kinase kinase kinase 20 (.1)
Lus10029019
149 / 7e-47
AT3G50310 96 / 3e-24
MAPKK kinase 20, mitogen-activated protein kinase kinase kinase 20 (.1)
Lus10034242
150 / 2e-45
AT3G50310 190 / 2e-58
MAPKK kinase 20, mitogen-activated protein kinase kinase kinase 20 (.1)
Lus10029023
147 / 6e-45
AT3G50310 147 / 8e-43
MAPKK kinase 20, mitogen-activated protein kinase kinase kinase 20 (.1)
Lus10034288
142 / 4e-42
AT3G50310 181 / 5e-55
MAPKK kinase 20, mitogen-activated protein kinase kinase kinase 20 (.1)
Lus10039141
140 / 4e-41
AT3G46140 168 / 1e-49
Protein kinase superfamily protein (.1)
Lus10034285
138 / 1e-40
AT5G27510 183 / 6e-56
Protein kinase superfamily protein (.1)
Lus10031963
125 / 8e-38
AT3G06030 87 / 1e-21
NPK1-related protein kinase 3 (.1)
PFAM info
Clan ID
Clan name
Pfam ID
Pfam name
Pfam description
CL0016
PKinase
PF00069
Pkinase
Protein kinase domain
Representative CDS sequence
>Lus10029047 pacid=23151811 polypeptide=Lus10029047 locus=Lus10029047.g ID=Lus10029047.BGIv1.0 annot-version=v1.0
ATGGAGAGCCGGGAGATACGTCCGACGGGAAGGGACTTCAGGGGAACGGTCAGATACCTTCCGCCGGAGATGATTTGGCTGGGGAAGGTGTCCCCGGCGA
TGGATATATGGGCTTTGGGATGCAGTGTGATCGAGATGCTGACCGGAAACTTGCCGTGGAATGATTTGAAGGAGGAAAAAGATGTGATGAGCGTGATCGG
AAAGGGAGGTCAGCCGGAGATTCCGGAGTGGGTTTCCGAAGAGGGAAAGGATTTTCTGCACAAGTGCTTTATTAGGTGTTCGCAGCAGCGTTTTCCGGCT
AAATTGCTTATGCAGCACCCGTTCGTCACTGGCGGGAGGATTTCGAAGGCGGTGATCGGACCAACAGGAAGGAATCGGAGTGTTGGCAGGGAAACAATGG
CGGCGCCAGAGCAGAGGTCCCCTCCTGCCGCTGCTGTTTACACTCTGTTTCCTACTCATCAAGCTGCTTTGGTCGCACTTTGA
AA sequence
>Lus10029047 pacid=23151811 polypeptide=Lus10029047 locus=Lus10029047.g ID=Lus10029047.BGIv1.0 annot-version=v1.0
MESREIRPTGRDFRGTVRYLPPEMIWLGKVSPAMDIWALGCSVIEMLTGNLPWNDLKEEKDVMSVIGKGGQPEIPEWVSEEGKDFLHKCFIRCSQQRFPA
KLLMQHPFVTGGRISKAVIGPTGRNRSVGRETMAAPEQRSPPAAAVYTLFPTHQAALVAL
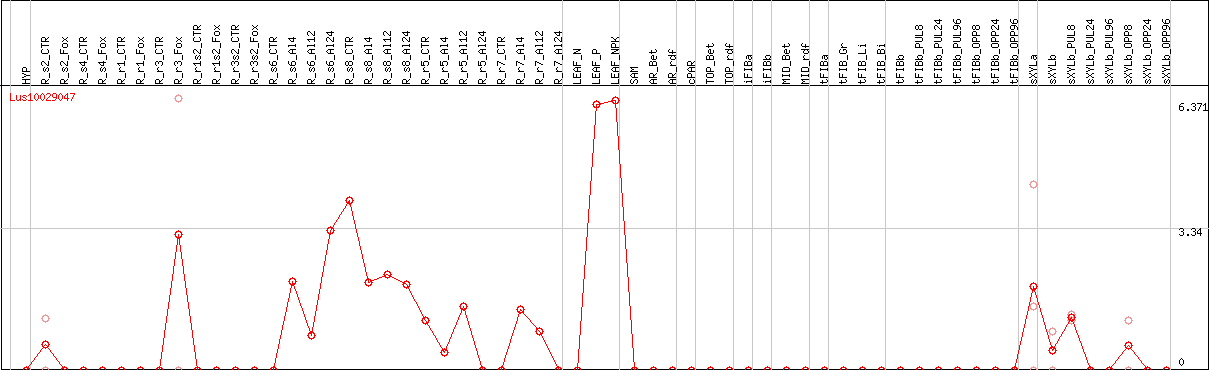
DESeq2's median of ratios [FLAX]
Coexpressed genes
Lus10029047 coexpression network
*The number of genes in the network is adjusted within 50 genes.
*Gene name represents symbol(s) of closest Arabidopsis gene if symbol(s) for the gene itself doesn't exist.
*Circle diameter represents the number of connection with other genes within this network.
*Color for gene name represents subnetwork based on the result of network clustering.