External link
Symbol
Arabidopsis homologues
Locus ID
BLAST score/e-value
TF class
Alias
TAIR10 short description
AT3G57120 70 / 3e-14
Protein kinase superfamily protein (.1)
AT2G33580 59 / 4e-10
Protein kinase superfamily protein (.1)
AT3G21630 56 / 2e-09
LYSMRLK1, CERK1
LYSM DOMAIN RECEPTOR-LIKE KINASE 1, chitin elicitor receptor kinase 1 (.1)
AT2G02800 56 / 3e-09
Kin2, APK2B
protein kinase 2B (.1.2)
AT1G29730 55 / 5e-09
Leucine-rich repeat transmembrane protein kinase (.1)
AT1G14370 54 / 2e-08
Kin1, PBL2, APK2A
PBS1-like 2, kinase 1, protein kinase 2A (.1)
AT2G18890 53 / 2e-08
Protein kinase superfamily protein (.1.2)
AT4G21390 52 / 5e-08
B120
S-locus lectin protein kinase family protein (.1)
AT1G09970 52 / 1e-07
RLK7, LRRXI-23 ,LRR XI-23
receptor-like kinase 7, Leucine-rich receptor-like protein kinase family protein (.1.2)
AT5G38560 51 / 1e-07
AtPERK8
proline-rich extensin-like receptor kinase 8, Protein kinase superfamily protein (.1)
Paralogs
Gene ID
BLAST score/e-value
At best hit
BLAST score/e-value
TAIR10 short description
Lus10038716
60 / 1e-10
AT3G57120 407 / 1e-138
Protein kinase superfamily protein (.1)
Lus10021451
59 / 1e-10
AT3G57120 259 / 4e-85
Protein kinase superfamily protein (.1)
Lus10006746
57 / 1e-09
AT1G11340 836 / 0.0
S-locus lectin protein kinase family protein (.1)
Lus10016113
56 / 4e-09
AT3G57120 447 / 8e-154
Protein kinase superfamily protein (.1)
Lus10006745
56 / 5e-09
AT1G11340 774 / 0.0
S-locus lectin protein kinase family protein (.1)
Lus10037586
55 / 1e-08
AT1G51940 807 / 0.0
protein kinase family protein / peptidoglycan-binding LysM domain-containing protein (.1)
Lus10006841
54 / 2e-08
AT1G51940 812 / 0.0
protein kinase family protein / peptidoglycan-binding LysM domain-containing protein (.1)
Lus10013223
53 / 2e-08
AT1G76360 400 / 8e-139
Protein kinase superfamily protein (.1)
Lus10020080
53 / 4e-08
AT4G21390 730 / 0.0
S-locus lectin protein kinase family protein (.1)
PFAM info
Clan ID
Clan name
Pfam ID
Pfam name
Pfam description
CL0016
PKinase
PF00069
Pkinase
Protein kinase domain
Representative CDS sequence
>Lus10029721 pacid=23152046 polypeptide=Lus10029721 locus=Lus10029721.g ID=Lus10029721.BGIv1.0 annot-version=v1.0
ATGGATGTCGAGAATGGAGATCGCACTGGGGGTGGCTCGTGGACTACACTACATCCACCACTGCACAGGATTCGATGTCGTCTTCATTACACCCATATCA
AAAGCTCCAACGTCATCCTCAACCGTACTTCTCAACAAACCAAAGCCATGATATGCAATTTTGGCCTTGCACATGCTAATGGGCAGGCGGCTAATGGCTT
ACGAGACAACGAGCAATACGATGGGTACTTGGCACCTGAGACTCGTTGGCAAGGGATAGTGACACAGGAGTCGGATAGTGTATGCATTCGGGTATTGCTG
TTAGAGCTGCTTCCGGGTAAGGATCCTTTGAAGTATAATATCGTAGCAACGGCGAAGGAAATATTCTTAGGCGGGGACGAGGTACGCAAAATAGATGAGG
AGGTGAGGAATTTGATGGATAAGAGGCTGGGTAACTTCATCCCTCTCAAGATTGCGAGAAATGCAATACGGGTAACCCTGCTTTGCGTCAGTGATGATCA
CAGTTTGCGCCCAAACATGAGCTTTGTATTAGAAAGTCCAACGACATTACTTACTACAGTTGGCCCAATTGAATGA
AA sequence
>Lus10029721 pacid=23152046 polypeptide=Lus10029721 locus=Lus10029721.g ID=Lus10029721.BGIv1.0 annot-version=v1.0
MDVENGDRTGGGSWTTLHPPLHRIRCRLHYTHIKSSNVILNRTSQQTKAMICNFGLAHANGQAANGLRDNEQYDGYLAPETRWQGIVTQESDSVCIRVLL
LELLPGKDPLKYNIVATAKEIFLGGDEVRKIDEEVRNLMDKRLGNFIPLKIARNAIRVTLLCVSDDHSLRPNMSFVLESPTTLLTTVGPIE
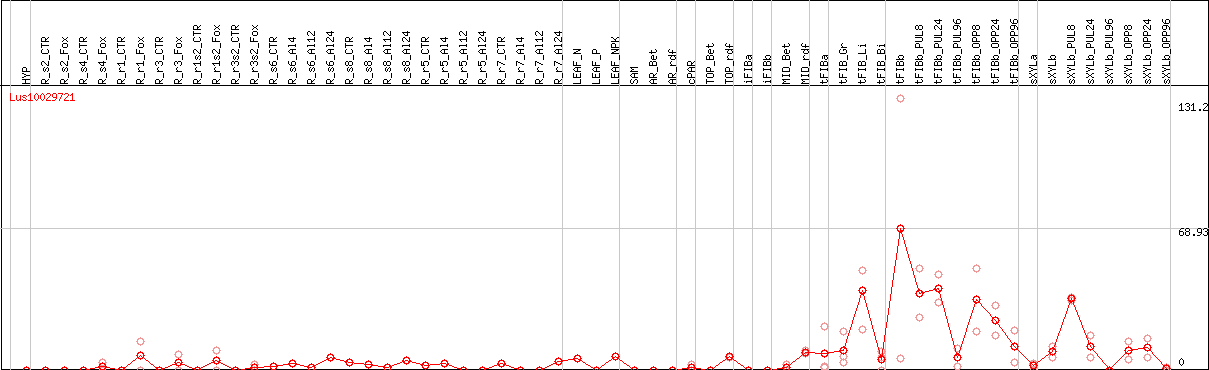
DESeq2's median of ratios [FLAX]
Coexpressed genes
Lus10029721 coexpression network
*The number of genes in the network is adjusted within 50 genes.
*Gene name represents symbol(s) of closest Arabidopsis gene if symbol(s) for the gene itself doesn't exist.
*Circle diameter represents the number of connection with other genes within this network.
*Color for gene name represents subnetwork based on the result of network clustering.