External link
Symbol
Arabidopsis homologues
Locus ID
BLAST score/e-value
TF class
Alias
TAIR10 short description
AT3G47440 67 / 1e-14
TIP5;1
tonoplast intrinsic protein 5;1 (.1)
AT3G16240 65 / 1e-13
DELTA-TIP1, ATTIP2;1, AQP1, DELTA-TIP
delta tonoplast integral protein (.1)
AT5G47450 59 / 3e-11
ATTIP2;3, DELTA-TIP3
DELTA-TONOPLAST INTRINSIC PROTEIN 3, ARABIDOPSIS THALIANA TONOPLAST INTRINSIC PROTEIN 2;3, tonoplast intrinsic protein 2;3 (.1)
AT3G26520 54 / 2e-09
TIP1;2, SITIP, GAMMA-TIP2, TIP2
SALT-STRESS INDUCIBLE TONOPLAST INTRINSIC PROTEIN, tonoplast intrinsic protein 2 (.1)
AT2G36830 52 / 7e-09
TIP1;1, GAMMA-TIP1, GAMMA-TIP
TONOPLAST INTRINSIC PROTEIN 1;1, GAMMA TONOPLAST INTRINSIC PROTEIN 1, gamma tonoplast intrinsic protein (.1)
AT1G73190 47 / 3e-07
ALPHA-TIP, TIP3;1
ALPHA-TONOPLAST INTRINSIC PROTEIN, Aquaporin-like superfamily protein (.1)
AT4G01470 47 / 3e-07
ATTIP1.3, GAMMA-TIP3, TIP1;3
tonoplast intrinsic protein 1;3 (.1)
AT4G17340 45 / 1e-06
TIP2;2, DELTA-TIP2
tonoplast intrinsic protein 2;2 (.1)
AT1G17810 44 / 7e-06
BETA-TIP
beta-tonoplast intrinsic protein (.1)
AT2G25810 39 / 0.0003
TIP4;1
tonoplast intrinsic protein 4;1 (.1)
Paralogs
Gene ID
BLAST score/e-value
At best hit
BLAST score/e-value
TAIR10 short description
Lus10038293
63 / 9e-13
AT3G16240 396 / 2e-141
delta tonoplast integral protein (.1)
Lus10025808
62 / 1e-12
AT3G16240 389 / 2e-138
delta tonoplast integral protein (.1)
Lus10022611
49 / 9e-08
AT2G36830 403 / 5e-144
TONOPLAST INTRINSIC PROTEIN 1;1, GAMMA TONOPLAST INTRINSIC PROTEIN 1, gamma tonoplast intrinsic protein (.1)
Lus10021510
49 / 1e-07
AT2G36830 402 / 9e-144
TONOPLAST INTRINSIC PROTEIN 1;1, GAMMA TONOPLAST INTRINSIC PROTEIN 1, gamma tonoplast intrinsic protein (.1)
Lus10003288
47 / 3e-07
AT4G01470 388 / 6e-138
tonoplast intrinsic protein 1;3 (.1)
Lus10018256
45 / 2e-06
AT1G17810 370 / 7e-131
beta-tonoplast intrinsic protein (.1)
Lus10023913
44 / 4e-06
AT2G36830 391 / 3e-139
TONOPLAST INTRINSIC PROTEIN 1;1, GAMMA TONOPLAST INTRINSIC PROTEIN 1, gamma tonoplast intrinsic protein (.1)
Lus10036187
44 / 6e-06
AT1G73190 382 / 4e-135
ALPHA-TONOPLAST INTRINSIC PROTEIN, Aquaporin-like superfamily protein (.1)
Lus10005885
44 / 6e-06
AT4G01470 395 / 1e-140
tonoplast intrinsic protein 1;3 (.1)
PFAM info
Clan ID
Clan name
Pfam ID
Pfam name
Pfam description
PF00230
MIP
Major intrinsic protein
Representative CDS sequence
>Lus10031157 pacid=23151063 polypeptide=Lus10031157 locus=Lus10031157.g ID=Lus10031157.BGIv1.0 annot-version=v1.0
ATGCCTCCGATCTCACTCTCGTCCCGCTTCCACCAATCCGTAACCCCGGCAGCCCTCAGATCGTACCTCGCCGAGTTCATCTCCACCTTCTTCTTCGTCT
TCGCCGTCGTCGGCTCTTCCATGGCTTCCAAGAAACTGACCCCTGATCAAGCCGGCGGCGGCGGCAGCTCGGCGGGTCTTGTGACGGTGGCGATGGCAAA
CGCGTTTGCACTTTCCTCGGCGGTTTACGTTGCCGCCGGAGCCTCTGGTGGACACGTCAACCCCGCCGTCACTTTCGCGATGGCTGGCGGGGGCCCAGCC
AATATTAATATGTTCGAAATTTCATATGTTAAAGGTGTAATACGGATGTAG
AA sequence
>Lus10031157 pacid=23151063 polypeptide=Lus10031157 locus=Lus10031157.g ID=Lus10031157.BGIv1.0 annot-version=v1.0
MPPISLSSRFHQSVTPAALRSYLAEFISTFFFVFAVVGSSMASKKLTPDQAGGGGSSAGLVTVAMANAFALSSAVYVAAGASGGHVNPAVTFAMAGGGPA
NINMFEISYVKGVIRM
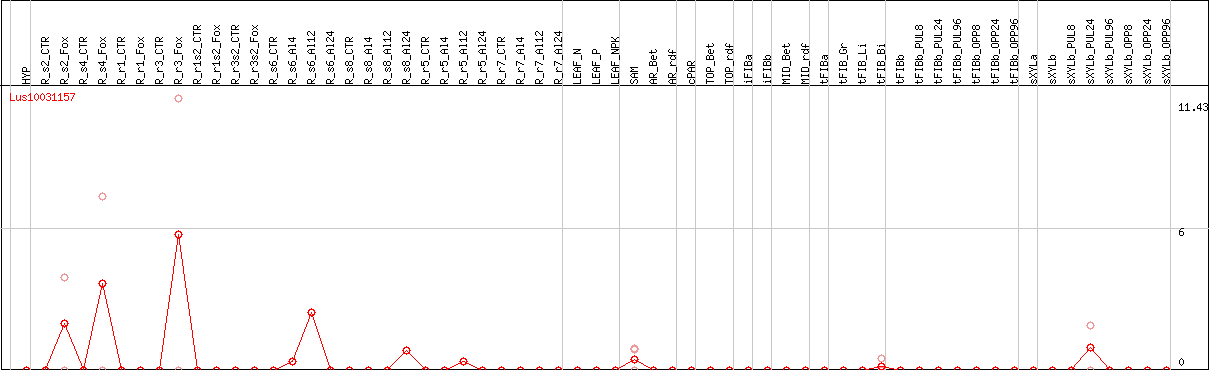
DESeq2's median of ratios [FLAX]
Coexpressed genes
Lus10031157 coexpression network
*The number of genes in the network is adjusted within 50 genes.
*Gene name represents symbol(s) of closest Arabidopsis gene if symbol(s) for the gene itself doesn't exist.
*Circle diameter represents the number of connection with other genes within this network.
*Color for gene name represents subnetwork based on the result of network clustering.