External link
Symbol
Arabidopsis homologues
Locus ID
BLAST score/e-value
TF class
Alias
TAIR10 short description
AT3G47420 125 / 6e-35
AtG3Pp1, ATPS3
Glycerol-3-phosphate permease 1, phosphate starvation-induced gene 3 (.1)
AT4G25220 112 / 2e-30
AtG3Pp2, RHS15
glycerol-3-phosphate permease 2, root hair specific 15 (.1)
AT4G17550 111 / 6e-30
AtG3Pp4
glycerol-3-phosphate permease 4, Major facilitator superfamily protein (.1)
AT1G30560 110 / 1e-29
AtG3Pp3
glycerol-3-phosphate permease 3, Major facilitator superfamily protein (.1)
AT2G13100 100 / 2e-26
AtG3Pp5
glycerol-3-phosphate permease 5, Major facilitator superfamily protein (.1.2.3)
Paralogs
Gene ID
BLAST score/e-value
At best hit
BLAST score/e-value
TAIR10 short description
Lus10031153
164 / 9e-50
AT3G47420 695 / 0.0
Glycerol-3-phosphate permease 1, phosphate starvation-induced gene 3 (.1)
Lus10027211
139 / 1e-41
AT3G47420 454 / 9e-159
Glycerol-3-phosphate permease 1, phosphate starvation-induced gene 3 (.1)
Lus10038923
139 / 1e-40
AT3G47420 586 / 0.0
Glycerol-3-phosphate permease 1, phosphate starvation-induced gene 3 (.1)
Lus10027210
133 / 8e-38
AT3G47420 705 / 0.0
Glycerol-3-phosphate permease 1, phosphate starvation-induced gene 3 (.1)
Lus10040154
116 / 1e-31
AT4G17550 734 / 0.0
glycerol-3-phosphate permease 4, Major facilitator superfamily protein (.1)
Lus10004358
115 / 3e-31
AT4G17550 725 / 0.0
glycerol-3-phosphate permease 4, Major facilitator superfamily protein (.1)
Lus10040002
96 / 3e-24
AT2G13100 708 / 0.0
glycerol-3-phosphate permease 5, Major facilitator superfamily protein (.1.2.3)
Locus ID
BLAST score/e-value
At best hit
BLAST score/e-value
TAIR10 short description
Potri.003G109300
138 / 8e-40
AT3G47420 694 / 0.0
Glycerol-3-phosphate permease 1, phosphate starvation-induced gene 3 (.1)
Potri.001G124200
138 / 1e-39
AT3G47420 711 / 0.0
Glycerol-3-phosphate permease 1, phosphate starvation-induced gene 3 (.1)
Potri.001G152300
112 / 4e-30
AT4G17550 692 / 0.0
glycerol-3-phosphate permease 4, Major facilitator superfamily protein (.1)
Potri.003G082366
109 / 4e-29
AT4G17550 624 / 0.0
glycerol-3-phosphate permease 4, Major facilitator superfamily protein (.1)
Potri.018G115000
99 / 2e-25
AT2G13100 699 / 0.0
glycerol-3-phosphate permease 5, Major facilitator superfamily protein (.1.2.3)
PFAM info
Representative CDS sequence
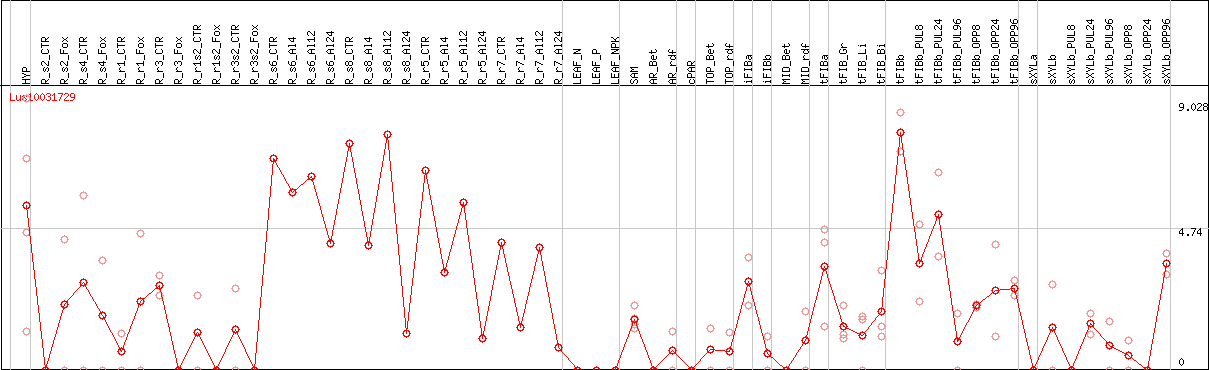
>Lus10031729 pacid=23180658 polypeptide=Lus10031729 locus=Lus10031729.g ID=Lus10031729.BGIv1.0 annot-version=v1.0
ATGTTGCTGACAGGAGTGTTCGTCAACGGTCCATACGCGCTCATAACGACTGCGGTATCAGCCGATCTGGACATGCACAGCTCGTTGAGAGGCAACTCGA
GGGCGTTGGCTACGGTCACAGCCATAATCGACGGGACCGGTTCAGTTGGGGCAGCGATCGGACCGTTGCTGACCGGGTATATATCAGCTAGTAGTTGGGG
TCCGGTTTTTGTCATGTTGATGGTTGCCGCCTTTGTGGCCGGGTTGCTATTGACTAGGCTTGTTGTTGCCGAGGTTGGTGCTAAGATTGTCGAGTCCAGG
TGCGAGGCAAGTTCGTCGATTGATGTTGATGTTTGA
AA sequence
>Lus10031729 pacid=23180658 polypeptide=Lus10031729 locus=Lus10031729.g ID=Lus10031729.BGIv1.0 annot-version=v1.0
MLLTGVFVNGPYALITTAVSADLDMHSSLRGNSRALATVTAIIDGTGSVGAAIGPLLTGYISASSWGPVFVMLMVAAFVAGLLLTRLVVAEVGAKIVESR
CEASSSIDVDV
DESeq2's median of ratios [FLAX]
Coexpressed genes
Lus10031729 coexpression network
*The number of genes in the network is adjusted within 50 genes.
*Gene name represents symbol(s) of closest Arabidopsis gene if symbol(s) for the gene itself doesn't exist.
*Circle diameter represents the number of connection with other genes within this network.
*Color for gene name represents subnetwork based on the result of network clustering.