External link
Symbol
Arabidopsis homologues
Locus ID
BLAST score/e-value
TF class
Alias
TAIR10 short description
AT5G43700 247 / 3e-84
AUX_IAA
IAA4, ATAUX2-11
indole-3-acetic acid inducible 4, AUXIN INDUCIBLE 2-11, AUX/IAA transcriptional regulator family protein (.1)
AT1G04240 247 / 3e-84
AUX_IAA
IAA3, SHY2
SHORT HYPOCOTYL 2, indole-3-acetic acid inducible 3, AUX/IAA transcriptional regulator family protein (.1)
AT3G23030 207 / 1e-68
AUX_IAA
IAA2
indole-3-acetic acid inducible 2 (.1)
AT4G14560 201 / 3e-66
AUX_IAA
AXR5, IAA1
AUXIN RESISTANT 5, indole-3-acetic acid inducible (.1)
AT3G04730 180 / 2e-57
AUX_IAA
IAA16
indoleacetic acid-induced protein 16 (.1)
AT4G14550 171 / 1e-53
AUX_IAA
SLR, IAA14
SOLITARY ROOT, indole-3-acetic acid inducible 14 (.1)
AT4G29080 169 / 5e-52
AUX_IAA
IAA27, PAP2
indole-3-acetic acid inducible 27, phytochrome-associated protein 2 (.1)
AT3G23050 164 / 1e-50
AUX_IAA
AXR2, IAA7
AUXIN RESISTANT 2, indole-3-acetic acid 7 (.1.2)
AT3G15540 160 / 6e-50
AUX_IAA
MSG2, IAA19
MASSUGU 2, indole-3-acetic acid inducible 19 (.1)
AT1G04250 159 / 3e-49
AUX_IAA
IAA17, AXR3
indole-3-acetic acid inducible 17, AUXIN RESISTANT 3, AUX/IAA transcriptional regulator family protein (.1)
Paralogs
Gene ID
BLAST score/e-value
At best hit
BLAST score/e-value
TAIR10 short description
Lus10039413
379 / 3e-136
AT1G04240 250 / 2e-85
SHORT HYPOCOTYL 2, indole-3-acetic acid inducible 3, AUX/IAA transcriptional regulator family protein (.1)
Lus10014729
236 / 2e-79
AT1G04240 230 / 2e-77
SHORT HYPOCOTYL 2, indole-3-acetic acid inducible 3, AUX/IAA transcriptional regulator family protein (.1)
Lus10002723
223 / 1e-74
AT5G43700 221 / 4e-74
indole-3-acetic acid inducible 4, AUXIN INDUCIBLE 2-11, AUX/IAA transcriptional regulator family protein (.1)
Lus10024853
217 / 8e-72
AT1G04240 216 / 1e-71
SHORT HYPOCOTYL 2, indole-3-acetic acid inducible 3, AUX/IAA transcriptional regulator family protein (.1)
Lus10018764
214 / 8e-71
AT5G43700 210 / 4e-69
indole-3-acetic acid inducible 4, AUXIN INDUCIBLE 2-11, AUX/IAA transcriptional regulator family protein (.1)
Lus10028222
192 / 4e-61
AT5G65670 322 / 3e-110
indole-3-acetic acid inducible 9 (.1.2)
Lus10042929
180 / 1e-55
AT5G65670 356 / 3e-122
indole-3-acetic acid inducible 9 (.1.2)
Lus10039414
168 / 3e-52
AT4G14550 305 / 1e-105
SOLITARY ROOT, indole-3-acetic acid inducible 14 (.1)
Lus10011583
167 / 2e-51
AT5G65670 333 / 2e-114
indole-3-acetic acid inducible 9 (.1.2)
Locus ID
BLAST score/e-value
At best hit
BLAST score/e-value
TAIR10 short description
Potri.010G078400
261 / 7e-90
AT5G43700 248 / 9e-85
indole-3-acetic acid inducible 4, AUXIN INDUCIBLE 2-11, AUX/IAA transcriptional regulator family protein (.1)
Potri.008G161100
262 / 8e-90
AT5G43700 238 / 3e-80
indole-3-acetic acid inducible 4, AUXIN INDUCIBLE 2-11, AUX/IAA transcriptional regulator family protein (.1)
Potri.005G218200
253 / 1e-86
AT5G43700 243 / 2e-82
indole-3-acetic acid inducible 4, AUXIN INDUCIBLE 2-11, AUX/IAA transcriptional regulator family protein (.1)
Potri.013G041300
253 / 1e-86
AT5G43700 239 / 5e-81
indole-3-acetic acid inducible 4, AUXIN INDUCIBLE 2-11, AUX/IAA transcriptional regulator family protein (.1)
Potri.005G053800
251 / 9e-86
AT5G43700 239 / 7e-81
indole-3-acetic acid inducible 4, AUXIN INDUCIBLE 2-11, AUX/IAA transcriptional regulator family protein (.1)
Potri.002G045000
245 / 2e-83
AT5G43700 236 / 5e-80
indole-3-acetic acid inducible 4, AUXIN INDUCIBLE 2-11, AUX/IAA transcriptional regulator family protein (.1)
Potri.008G161200
181 / 1e-57
AT4G14550 343 / 1e-120
SOLITARY ROOT, indole-3-acetic acid inducible 14 (.1)
Potri.013G041400
181 / 3e-57
AT3G04730 306 / 6e-106
indoleacetic acid-induced protein 16 (.1)
Potri.002G044900
173 / 1e-54
AT4G14550 286 / 1e-98
SOLITARY ROOT, indole-3-acetic acid inducible 14 (.1)
Potri.005G053900
173 / 2e-54
AT3G04730 317 / 3e-110
indoleacetic acid-induced protein 16 (.1)
PFAM info
Clan ID
Clan name
Pfam ID
Pfam name
Pfam description
CL0072
Ubiquitin
PF02309
AUX_IAA
AUX/IAA family
Representative CDS sequence
>Lus10039488 pacid=23175631 polypeptide=Lus10039488 locus=Lus10039488.g ID=Lus10039488.BGIv1.0 annot-version=v1.0
ATGGAAGGTGCTACATATGAAAGTGACTTGAACTTCGAGGCAACCGAGCTCAGGCTTGGACTGCCTGGCTCAGGAGAAGAAGAAACTGCTGTTAAAAGCA
ACAACAAACGACCTATGCCTGCAGAGACCAACGAAGAAATCGAAGCCAAGGGAAGATCTGGAGATCATGTTCAAGCTGCCCCTGCTGCTAAGGCACAGAT
TGTGGGCTGGCCACCAATCCGATCCTACAGGAAGAATAGCTTGCAGCCAAAGAAAAGTACTGAAGCTGCTGATGGTGCTAGCGGGATGTACGTGAAAGTT
AGCATGGATGGAGCACCATATCTCAGGAAGATTGACCTCAAGGTCTATAGAGGCTACCCTGAACTCCTAATGGCTTTGGAGACCATGTTTAAGTTTGCTG
CTGGTGTCTACTCTGAGAGAGAAGGTTATAAAGGGTCCGAGCACGTACCTACTTATGAAGACAAAGATGGTGACTGGATGCTCGTTGGAGATGTTCCTTG
GGACATGTTCATGTCATCCTGTAAGAGGTTGAGAATCATGAAAGGATCAGAAGCAAGAGGATTGGGATGTGGTGTATGA
AA sequence
>Lus10039488 pacid=23175631 polypeptide=Lus10039488 locus=Lus10039488.g ID=Lus10039488.BGIv1.0 annot-version=v1.0
MEGATYESDLNFEATELRLGLPGSGEEETAVKSNNKRPMPAETNEEIEAKGRSGDHVQAAPAAKAQIVGWPPIRSYRKNSLQPKKSTEAADGASGMYVKV
SMDGAPYLRKIDLKVYRGYPELLMALETMFKFAAGVYSEREGYKGSEHVPTYEDKDGDWMLVGDVPWDMFMSSCKRLRIMKGSEARGLGCGV
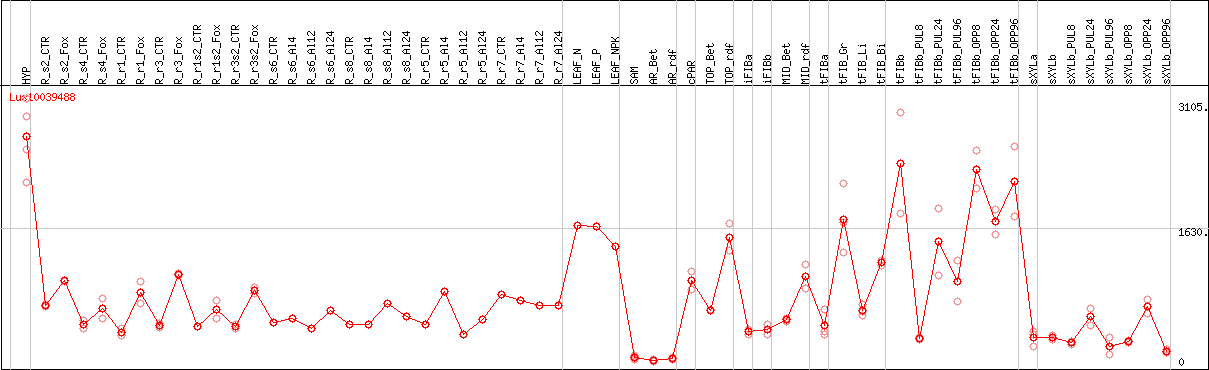
DESeq2's median of ratios [FLAX]
Coexpressed genes
Lus10039488 coexpression network
*The number of genes in the network is adjusted within 50 genes.
*Gene name represents symbol(s) of closest Arabidopsis gene if symbol(s) for the gene itself doesn't exist.
*Circle diameter represents the number of connection with other genes within this network.
*Color for gene name represents subnetwork based on the result of network clustering.