External link
Symbol
Arabidopsis homologues
Locus ID
BLAST score/e-value
TF class
Alias
TAIR10 short description
AT1G05530 57 / 5e-11
UGT75B2, UGT2
UDP-GLUCOSYL TRANSFERASE 2, UDP-glucosyl transferase 75B2 (.1)
AT1G05560 55 / 3e-10
UGT75B1, UGT1
UDP-GLUCOSE TRANSFERASE 1, UDP-glucosyltransferase 75B1 (.1)
AT4G14090 54 / 5e-10
UDP-Glycosyltransferase superfamily protein (.1)
AT4G15550 51 / 7e-09
IAGLU
indole-3-acetate beta-D-glucosyltransferase (.1)
AT1G24100 47 / 2e-07
UGT74B1
UDP-glucosyl transferase 74B1 (.1)
AT2G31750 41 / 3e-05
UGT74D1
UDP-glucosyl transferase 74D1 (.1)
AT2G23210 40 / 4e-05
UDP-Glycosyltransferase superfamily protein (.1)
AT2G36970 40 / 7e-05
UDP-Glycosyltransferase superfamily protein (.1)
AT4G15490 39 / 0.0002
UGT84A3
UDP-Glycosyltransferase superfamily protein (.1)
AT2G43820 38 / 0.0002
SGT1, ATSAGT1, GT, UGT74F2
UDP-glucose:salicylic acid glucosyltransferase 1, Arabidopsis thaliana salicylic acid glucosyltransferase 1, UDP-glucosyltransferase 74F2 (.1)
Paralogs
Gene ID
BLAST score/e-value
At best hit
BLAST score/e-value
TAIR10 short description
Lus10021610
110 / 8e-30
AT1G05560 372 / 6e-125
UDP-GLUCOSE TRANSFERASE 1, UDP-glucosyltransferase 75B1 (.1)
Lus10015515
94 / 7e-24
AT4G15550 379 / 3e-127
indole-3-acetate beta-D-glucosyltransferase (.1)
Lus10019989
89 / 3e-22
AT4G15550 379 / 5e-127
indole-3-acetate beta-D-glucosyltransferase (.1)
Lus10009412
47 / 2e-07
AT2G43820 474 / 1e-165
UDP-glucose:salicylic acid glucosyltransferase 1, Arabidopsis thaliana salicylic acid glucosyltransferase 1, UDP-glucosyltransferase 74F2 (.1)
Lus10020556
47 / 2e-07
AT2G43820 472 / 1e-164
UDP-glucose:salicylic acid glucosyltransferase 1, Arabidopsis thaliana salicylic acid glucosyltransferase 1, UDP-glucosyltransferase 74F2 (.1)
Lus10006352
45 / 9e-07
AT2G43820 414 / 6e-142
UDP-glucose:salicylic acid glucosyltransferase 1, Arabidopsis thaliana salicylic acid glucosyltransferase 1, UDP-glucosyltransferase 74F2 (.1)
Lus10013924
44 / 2e-06
AT1G22400 551 / 0.0
ARABIDOPSIS THALIANA UDP-GLUCOSYL TRANSFERASE 85A1, UDP-Glycosyltransferase superfamily protein (.1)
Lus10008742
44 / 2e-06
AT2G43840 478 / 6e-167
UDP-glycosyltransferase 74 F1 (.1.2)
Lus10024118
44 / 3e-06
AT1G05675 375 / 2e-126
UDP-Glycosyltransferase superfamily protein (.1)
PFAM info
Representative CDS sequence
>Lus10040590 pacid=23157580 polypeptide=Lus10040590 locus=Lus10040590.g ID=Lus10040590.BGIv1.0 annot-version=v1.0
ATGGCAGCGGCAGCAGCCCAACAGCAGCGACAGCCACATGTGGTGATGGCAACATTCCCAGCACAAGGCCATATGAATCCCAGCGTTCATTTCTCCATCC
AGCTAGTACTCCTCGGATGCCGTGTCACTCTCCTCACCACCGTCTCCGGAAGACTCCTTATTACCAAGTCCAACATCCTCCTCCCACCTGGACTGTCCGT
CGTAACATTCTCTGATGGTTACGACGTGGCGGGGTCTTCTTGGAAGACCAAAACAAGCAGTGGGAGCAGTTGA
AA sequence
>Lus10040590 pacid=23157580 polypeptide=Lus10040590 locus=Lus10040590.g ID=Lus10040590.BGIv1.0 annot-version=v1.0
MAAAAAQQQRQPHVVMATFPAQGHMNPSVHFSIQLVLLGCRVTLLTTVSGRLLITKSNILLPPGLSVVTFSDGYDVAGSSWKTKTSSGSS
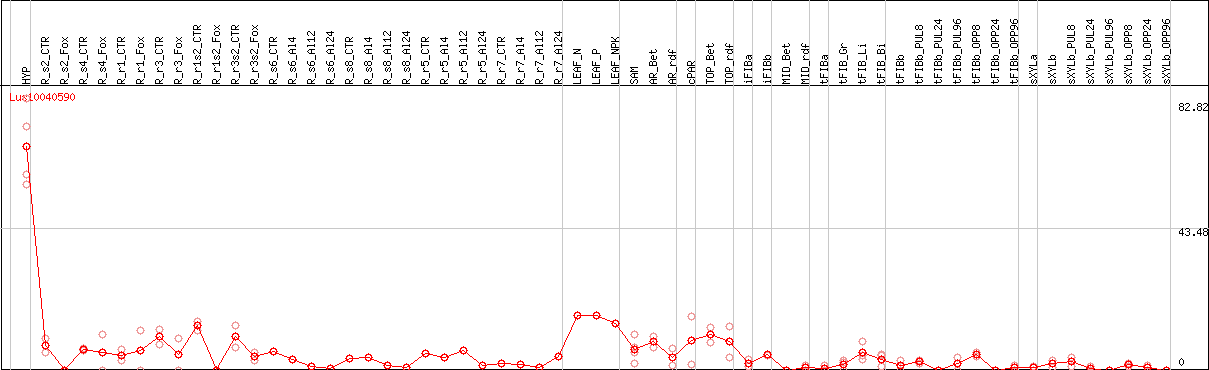
DESeq2's median of ratios [FLAX]
Coexpressed genes
Lus10040590 coexpression network
*The number of genes in the network is adjusted within 50 genes.
*Gene name represents symbol(s) of closest Arabidopsis gene if symbol(s) for the gene itself doesn't exist.
*Circle diameter represents the number of connection with other genes within this network.
*Color for gene name represents subnetwork based on the result of network clustering.