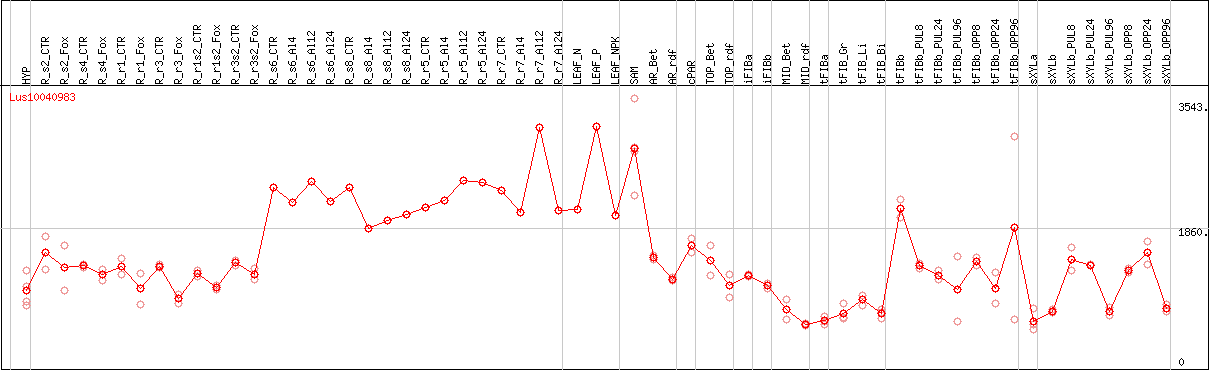
Lus10040983 [FLAX]


External link
JGI Phytozome v13
Symbol
Arabidopsis homologues
Locus ID BLAST score/e-value TF class Alias TAIR10 short description
AT4G14320 173 / 1e-57 Zinc-binding ribosomal protein family protein (.1.2)
AT3G23390 173 / 1e-57 Zinc-binding ribosomal protein family protein (.1)
Paralogs
Gene ID BLAST score/e-value At best hit BLAST score/e-value TAIR10 short description
Lus10038130 179 / 3e-60 AT4G14320 199 / 4e-68 Zinc-binding ribosomal protein family protein (.1.2)
Lus10013436 179 / 3e-60 AT3G23390 199 / 4e-68 Zinc-binding ribosomal protein family protein (.1)
Lus10010195 179 / 3e-60 AT4G14320 199 / 4e-68 Zinc-binding ribosomal protein family protein (.1.2)
Lus10000176 179 / 3e-60 AT4G14320 199 / 4e-68 Zinc-binding ribosomal protein family protein (.1.2)
Lus10017396 179 / 6e-60 AT4G14320 199 / 7e-68 Zinc-binding ribosomal protein family protein (.1.2)
Poplar homologues
Locus ID BLAST score/e-value At best hit BLAST score/e-value TAIR10 short description
Potri.010G251500 178 / 1e-59 AT4G14320 175 / 2e-58 Zinc-binding ribosomal protein family protein (.1.2)
Potri.007G071800 178 / 1e-59 AT4G14320 175 / 2e-58 Zinc-binding ribosomal protein family protein (.1.2)
Potri.005G092500 176 / 1e-58 AT4G14320 171 / 4e-57 Zinc-binding ribosomal protein family protein (.1.2)
PFAM info
Clan ID Clan name Pfam ID Pfam name Pfam description
CL0167 Zn_Beta_Ribbon PF00935 Ribosomal_L44 Ribosomal protein L44
Representative CDS sequence
>Lus10040983 pacid=23179765 polypeptide=Lus10040983 locus=Lus10040983.g ID=Lus10040983.BGIv1.0 annot-version=v1.0
ATGGTGAACGTTCCAAAGACAAAGAAGACCTACTGCAAGAGCAAGGAGTGCAAGAAGCACACTCTGCACAAGGTCACTCAGTACAAGAAGGGTAAGGATA
GTCTGGCAGCTCAAGGAAAGCGCCGTTATGATCGCAAACAATCTGGTTATGGAGGTCAAACCAAGCCTGTTTTCCACAAGAAGGCAAAAACCACGAAGAA
GATTGTTCTGAGGCTCCAGTGCCAAGGATGCAAGCATGTGTCTCAGCACCCAATCAAGAGGTGCAAGCATTTTGAGATAGGCGGAGACAAGAAGGGGAAG
GGAACATCTCTGTTCTAG
AA sequence
>Lus10040983 pacid=23179765 polypeptide=Lus10040983 locus=Lus10040983.g ID=Lus10040983.BGIv1.0 annot-version=v1.0
MVNVPKTKKTYCKSKECKKHTLHKVTQYKKGKDSLAAQGKRRYDRKQSGYGGQTKPVFHKKAKTTKKIVLRLQCQGCKHVSQHPIKRCKHFEIGGDKKGK
GTSLF

DESeq2's median of ratios [FLAX]

Order by: Show schematic diagram

Coexpressed genes

Only top 10 genes are shown Show allDownload tab-delimited text
Schematic diagram [FLAX] Schematic diagram [POPLAR]

*If you select 4 or less genes and then press "compare expression", expression will be shown as a graph. If you select more than 4 genes, expresion will be shown as a heat map.
*Color represents relative expression level among samples for each gene.
At best At TF class At alias At description Locus MR r Symbol HYPR_s2_CTRR_s2_FoxR_s4_CTRR_s4_FoxR_r1_CTRR_r1_FoxR_r3_CTRR_r3_FoxR_r1s2_CTRR_r1s2_FoxR_r3s2_CTRR_r3s2_FoxR_s6_CTRR_s6_Al4R_s6_Al12R_s6_Al24R_s8_CTRR_s8_Al4R_s8_Al12R_s8_Al24R_r5_CTRR_r5_Al4R_r5_Al12R_r5_Al24R_r7_CTRR_r7_Al4R_r7_Al12R_r7_Al24LEAF_NLEAF_PLEAF_NPKSAMAR_BetAR_rdfcPARTOP_BetTOP_rdfiFIBaiFIBbMID_BetMID_rdftFIBatFIB_GrtFIB_LitFIB_BitFIBbtFIBb_PUL8tFIBb_PUL24tFIBb_PUL96tFIBb_OPP8tFIBb_OPP24tFIBb_OPP96sXYLasXYLbsXYLb_PUL8sXYLb_PUL24sXYLb_PUL96sXYLb_OPP8sXYLb_OPP24sXYLb_OPP96
AT3G23390 Zinc-binding ribosomal protein... Lus10040983 0 1
AT3G23390 Zinc-binding ribosomal protein... Lus10013436 1.0 0.9617
AT2G34160 Alba DNA/RNA-binding protein (... Lus10002027 1.4 0.9606
AT3G52040 unknown protein Lus10039586 1.7 0.9258
AT2G18196 Heavy metal transport/detoxifi... Lus10010147 2.2 0.9068
AT3G53740 Ribosomal protein L36e family ... Lus10016501 4.0 0.9233
AT1G53850 PAE1, ATPAE1 ARABIDOPSIS 20S PROTEASOME ALP... Lus10003936 5.0 0.8578
AT4G18905 Transducin/WD40 repeat-like su... Lus10015348 6.3 0.8362
AT2G18400 ribosomal protein L6 family pr... Lus10026015 6.6 0.8848
AT2G29540 ATRPAC14, ATRPC... RNApolymerase 14 kDa subunit (... Lus10040717 6.7 0.8669
AT2G19740 Ribosomal protein L31e family ... Lus10042028 7.0 0.9005

Lus10040983 coexpression network

*The number of genes in the network is adjusted within 50 genes.
*Gene name represents symbol(s) of closest Arabidopsis gene if symbol(s) for the gene itself doesn't exist.
*Circle diameter represents the number of connection with other genes within this network.
*Color for gene name represents subnetwork based on the result of network clustering.