External link
Symbol
Arabidopsis homologues
Locus ID
BLAST score/e-value
TF class
Alias
TAIR10 short description
AT3G15540 224 / 4e-75
AUX_IAA
MSG2, IAA19
MASSUGU 2, indole-3-acetic acid inducible 19 (.1)
AT1G52830 189 / 1e-61
AUX_IAA
SHY1, IAA6
SHORT HYPOCOTYL 1, indole-3-acetic acid 6 (.1)
AT1G04240 167 / 5e-53
AUX_IAA
IAA3, SHY2
SHORT HYPOCOTYL 2, indole-3-acetic acid inducible 3, AUX/IAA transcriptional regulator family protein (.1)
AT1G15580 166 / 6e-53
AUX_IAA
ATAUX2-27, IAA5
AUXIN-INDUCIBLE 2-27, indole-3-acetic acid inducible 5 (.1)
AT5G43700 166 / 2e-52
AUX_IAA
IAA4, ATAUX2-11
indole-3-acetic acid inducible 4, AUXIN INDUCIBLE 2-11, AUX/IAA transcriptional regulator family protein (.1)
AT3G04730 152 / 2e-46
AUX_IAA
IAA16
indoleacetic acid-induced protein 16 (.1)
AT3G23050 149 / 6e-45
AUX_IAA
AXR2, IAA7
AUXIN RESISTANT 2, indole-3-acetic acid 7 (.1.2)
AT4G14550 148 / 1e-44
AUX_IAA
SLR, IAA14
SOLITARY ROOT, indole-3-acetic acid inducible 14 (.1)
AT1G04250 140 / 7e-42
AUX_IAA
IAA17, AXR3
indole-3-acetic acid inducible 17, AUXIN RESISTANT 3, AUX/IAA transcriptional regulator family protein (.1)
AT3G23030 139 / 8e-42
AUX_IAA
IAA2
indole-3-acetic acid inducible 2 (.1)
Paralogs
Gene ID
BLAST score/e-value
At best hit
BLAST score/e-value
TAIR10 short description
Potri.003G056900
323 / 2e-114
AT3G15540 206 / 4e-68
MASSUGU 2, indole-3-acetic acid inducible 19 (.1)
Potri.005G053800
157 / 1e-48
AT5G43700 239 / 7e-81
indole-3-acetic acid inducible 4, AUXIN INDUCIBLE 2-11, AUX/IAA transcriptional regulator family protein (.1)
Potri.002G044900
157 / 3e-48
AT4G14550 286 / 1e-98
SOLITARY ROOT, indole-3-acetic acid inducible 14 (.1)
Potri.013G041400
156 / 7e-48
AT3G04730 306 / 6e-106
indoleacetic acid-induced protein 16 (.1)
Potri.013G041300
154 / 2e-47
AT5G43700 239 / 5e-81
indole-3-acetic acid inducible 4, AUXIN INDUCIBLE 2-11, AUX/IAA transcriptional regulator family protein (.1)
Potri.005G218200
150 / 8e-46
AT5G43700 243 / 2e-82
indole-3-acetic acid inducible 4, AUXIN INDUCIBLE 2-11, AUX/IAA transcriptional regulator family protein (.1)
Potri.010G078300
149 / 1e-44
AT4G14550 319 / 1e-110
SOLITARY ROOT, indole-3-acetic acid inducible 14 (.1)
Potri.005G053900
148 / 1e-44
AT3G04730 317 / 3e-110
indoleacetic acid-induced protein 16 (.1)
Potri.008G161200
148 / 1e-44
AT4G14550 343 / 1e-120
SOLITARY ROOT, indole-3-acetic acid inducible 14 (.1)
Locus ID
BLAST score/e-value
At best hit
BLAST score/e-value
TAIR10 short description
Lus10039488
159 / 2e-49
AT5G43700 247 / 3e-84
indole-3-acetic acid inducible 4, AUXIN INDUCIBLE 2-11, AUX/IAA transcriptional regulator family protein (.1)
Lus10028222
161 / 3e-49
AT5G65670 322 / 3e-110
indole-3-acetic acid inducible 9 (.1.2)
Lus10039413
157 / 8e-49
AT1G04240 250 / 2e-85
SHORT HYPOCOTYL 2, indole-3-acetic acid inducible 3, AUX/IAA transcriptional regulator family protein (.1)
Lus10042929
154 / 1e-45
AT5G65670 356 / 3e-122
indole-3-acetic acid inducible 9 (.1.2)
Lus10014729
149 / 2e-45
AT1G04240 230 / 2e-77
SHORT HYPOCOTYL 2, indole-3-acetic acid inducible 3, AUX/IAA transcriptional regulator family protein (.1)
Lus10018764
149 / 5e-45
AT5G43700 210 / 4e-69
indole-3-acetic acid inducible 4, AUXIN INDUCIBLE 2-11, AUX/IAA transcriptional regulator family protein (.1)
Lus10002723
147 / 1e-44
AT5G43700 221 / 4e-74
indole-3-acetic acid inducible 4, AUXIN INDUCIBLE 2-11, AUX/IAA transcriptional regulator family protein (.1)
Lus10024853
146 / 4e-44
AT1G04240 216 / 1e-71
SHORT HYPOCOTYL 2, indole-3-acetic acid inducible 3, AUX/IAA transcriptional regulator family protein (.1)
Lus10011583
145 / 1e-42
AT5G65670 333 / 2e-114
indole-3-acetic acid inducible 9 (.1.2)
Lus10019241
144 / 3e-42
AT5G65670 356 / 4e-123
indole-3-acetic acid inducible 9 (.1.2)
PFAM info
Clan ID
Clan name
Pfam ID
Pfam name
Pfam description
CL0072
Ubiquitin
PF02309
AUX_IAA
AUX/IAA family
Representative CDS sequence
>Potri.001G177500.1 pacid=42788991 polypeptide=Potri.001G177500.1.p locus=Potri.001G177500 ID=Potri.001G177500.1.v4.1 annot-version=v4.1
ATGGCACAACCTCTTGGACTAGAAATCACAGAGCTAAGGTTGGGTCCACCGGGCAGCGAAAATGGACCAAAAAATGAAAAGAAAAGGGTTTTCTCAGAGT
TGTCCGGCGAAGCAAACAGCACAACCGATGGGCGAAAAACCCAAACAACGAGTCAAGTTGTGGGGTGGCCACCAGTATGTTCCTATCGAAAGAAGAATAG
TTTCAATGAGAAAGATAGCCATGAAACTTCAAAAATTTACGTGAAAGTTAGTATGGACGGAGCTCCTTTTCTCAGAAAAGTTGATTTGGGCATGCACAAG
GAGTATTCGGATCTTGTTGTCGCGTTGGAGAAGTTGTTTGGCTGTTTTGGAATCGGCAAAGCCTTGAAGGATACAGACGACTGCGAATACGTTCCCATAT
ATGAAGACAAGGATGGAGACTGGATGCTAGTGGGAGACGTGCCTTGGGAGATGTTTATTGAGTCTTGCAAGAGGCTAAGGATAATGAAGAGGTCAGAAGC
CAAGGGTTTTGGACTGCAGCCAAGAGGTGCTCTTCAGCAGGGAAATATTTCAAAAGATGATCGTGACTGA
AA sequence
>Potri.001G177500.1 pacid=42788991 polypeptide=Potri.001G177500.1.p locus=Potri.001G177500 ID=Potri.001G177500.1.v4.1 annot-version=v4.1
MAQPLGLEITELRLGPPGSENGPKNEKKRVFSELSGEANSTTDGRKTQTTSQVVGWPPVCSYRKKNSFNEKDSHETSKIYVKVSMDGAPFLRKVDLGMHK
EYSDLVVALEKLFGCFGIGKALKDTDDCEYVPIYEDKDGDWMLVGDVPWEMFIESCKRLRIMKRSEAKGFGLQPRGALQQGNISKDDRD
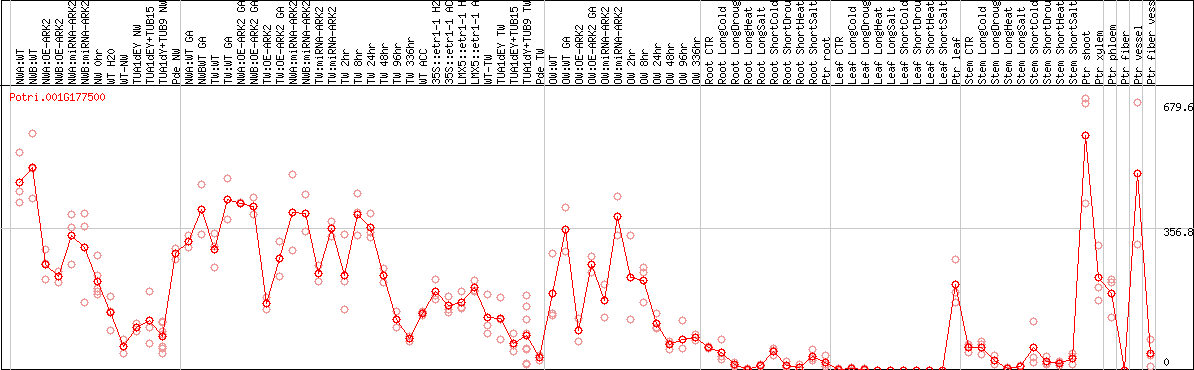
DESeq2's median of ratios [POPLAR]
Coexpressed genes
Potri.001G177500 coexpression network
*The number of genes in the network is adjusted within 50 genes.
*Gene name represents symbol(s) of closest Arabidopsis gene if symbol(s) for the gene itself doesn't exist.
*Circle diameter represents the number of connection with other genes within this network.
*Color for gene name represents subnetwork based on the result of network clustering.