External link
Symbol
Arabidopsis homologues
Locus ID
BLAST score/e-value
TF class
Alias
TAIR10 short description
AT4G16990 149 / 9e-42
RLM3
RESISTANCE TO LEPTOSPHAERIA MACULANS 3, disease resistance protein (TIR-NBS class), putative
AT5G46450 144 / 1e-39
Disease resistance protein (TIR-NBS-LRR class) family (.1)
AT3G44480 141 / 1e-38
COG1, RPP10, RPP1
recognition of peronospora parasitica 1, Disease resistance protein (TIR-NBS-LRR class) family (.1)
AT4G16890 140 / 2e-38
BAL, SNC1
SUPPRESSOR OF NPR1-1, CONSTITUTIVE 1, BALL, disease resistance protein (TIR-NBS-LRR class), putative (.1)
AT2G16870 140 / 2e-38
Disease resistance protein (TIR-NBS-LRR class) family (.1)
AT1G72860 140 / 3e-38
Disease resistance protein (TIR-NBS-LRR class) family (.1)
AT4G16860 139 / 5e-38
RPP5, RPP4
recognition of peronospora parasitica 4, Disease resistance protein (TIR-NBS-LRR class) family (.1)
AT1G63730 139 / 6e-38
Disease resistance protein (TIR-NBS-LRR class) family (.1)
AT3G44630 139 / 7e-38
Disease resistance protein (TIR-NBS-LRR class) family (.1), Disease resistance protein (TIR-NBS-LRR class) family (.2), Disease resistance protein (TIR-NBS-LRR class) family (.3)
AT3G44670 139 / 7e-38
Disease resistance protein (TIR-NBS-LRR class) family (.1), Disease resistance protein (TIR-NBS-LRR class) family (.2)
Paralogs
Locus ID
BLAST score/e-value
At best hit
BLAST score/e-value
TAIR10 short description
Lus10013729
166 / 4e-48
AT5G36930 310 / 2e-92
Disease resistance protein (TIR-NBS-LRR class) family (.1), Disease resistance protein (TIR-NBS-LRR class) family (.2)
Lus10011104
166 / 2e-47
AT5G17680 574 / 0.0
disease resistance protein (TIR-NBS-LRR class), putative (.1)
Lus10029722
164 / 8e-47
AT5G17680 608 / 0.0
disease resistance protein (TIR-NBS-LRR class), putative (.1)
Lus10042752
149 / 6e-46
AT4G16990 145 / 5e-41
RESISTANCE TO LEPTOSPHAERIA MACULANS 3, disease resistance protein (TIR-NBS class), putative
Lus10006929
148 / 2e-44
AT1G72890 146 / 1e-39
Disease resistance protein (TIR-NBS class) (.1), Disease resistance protein (TIR-NBS class) (.2)
Lus10014671
148 / 3e-44
AT5G36930 144 / 4e-39
Disease resistance protein (TIR-NBS-LRR class) family (.1), Disease resistance protein (TIR-NBS-LRR class) family (.2)
Lus10041060
154 / 2e-43
AT5G17680 641 / 0.0
disease resistance protein (TIR-NBS-LRR class), putative (.1)
Lus10014582
144 / 3e-42
AT1G27170 186 / 9e-56
transmembrane receptors;ATP binding (.1.2)
Lus10006928
144 / 4e-40
AT5G36930 165 / 5e-43
Disease resistance protein (TIR-NBS-LRR class) family (.1), Disease resistance protein (TIR-NBS-LRR class) family (.2)
Lus10032101
141 / 1e-39
AT1G27170 270 / 6e-80
transmembrane receptors;ATP binding (.1.2)
PFAM info
Clan ID
Clan name
Pfam ID
Pfam name
Pfam description
CL0173
STIR
PF13676
TIR_2
TIR domain
Representative CDS sequence
>Potri.005G062700.3 pacid=42804051 polypeptide=Potri.005G062700.3.p locus=Potri.005G062700 ID=Potri.005G062700.3.v4.1 annot-version=v4.1
ATGGCGTCAAGCTCTTCCGCCGTTACTCCTCTATGGAAGTATGATGTGTTCCTTAGTTTTAGAGGTGCTGACGTCCGCCATAACTTCCTTAGACATCTTT
ATGATGCTCTAGATCAAAATGAAATCGAAACATTTATCGACTACAAACTTGGTGCTGGAGAAGAGATCTCACGGATCCTCTTGGAAAAAATCGAACAATC
AAATGTTTCAATCGTCATTTTCTCCAAAAACTATGCAGATTCTCCTTGGTGTTTGGAAGAACTGGAGAAGATCCTCGAATGCAGGCAAACGTTACAGCAA
ATTGTTATACCAGTATTTTACCATGTTGATCCAACCCATGTCCGAGAGCTGAGTAACAGTTATGGAAATGCACTTTCCGAGCATCAGAAAAAAATCAGTT
CAGACAAGGTGGACAATTGGAAACGTGTTTTGATCGAAATAGCTGATCTAGAAGGCTGGCATTTTAATGACACTAAGAAAGAGTCTGAACTAGTCCAGGA
AATTGTTGATTACATTAGGAAGGAGCTAAAACCTTTATCCTCAAGCAATTTTGGTAACTTGGTTGAAATTGGTTCATGTATTGGAAAGGTTGATGATAAT
GAATATTTCATGTAA
AA sequence
>Potri.005G062700.3 pacid=42804051 polypeptide=Potri.005G062700.3.p locus=Potri.005G062700 ID=Potri.005G062700.3.v4.1 annot-version=v4.1
MASSSSAVTPLWKYDVFLSFRGADVRHNFLRHLYDALDQNEIETFIDYKLGAGEEISRILLEKIEQSNVSIVIFSKNYADSPWCLEELEKILECRQTLQQ
IVIPVFYHVDPTHVRELSNSYGNALSEHQKKISSDKVDNWKRVLIEIADLEGWHFNDTKKESELVQEIVDYIRKELKPLSSSNFGNLVEIGSCIGKVDDN
EYFM
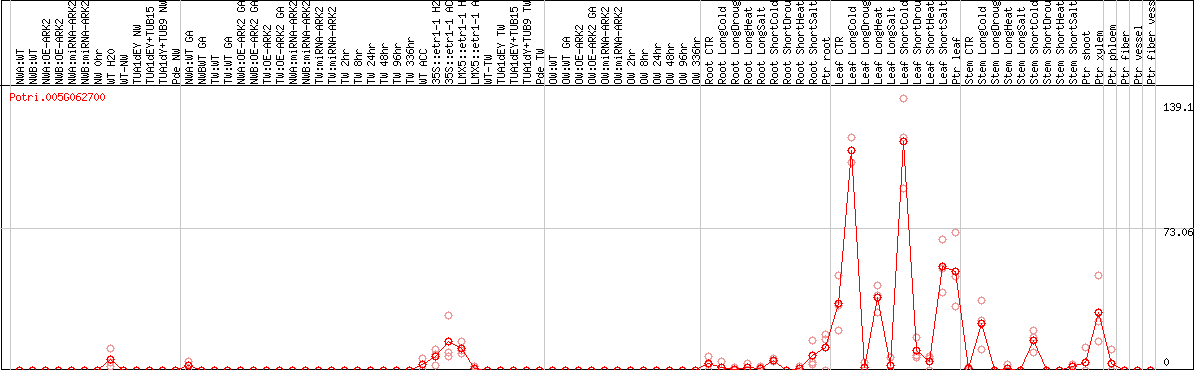
DESeq2's median of ratios [POPLAR]
Coexpressed genes
Potri.005G062700 coexpression network
*The number of genes in the network is adjusted within 50 genes.
*Gene name represents symbol(s) of closest Arabidopsis gene if symbol(s) for the gene itself doesn't exist.
*Circle diameter represents the number of connection with other genes within this network.
*Color for gene name represents subnetwork based on the result of network clustering.