External link
Symbol
Arabidopsis homologues
Locus ID
BLAST score/e-value
TF class
Alias
TAIR10 short description
AT1G23410 55 / 5e-10
Ribosomal protein S27a / Ubiquitin family protein (.1)
AT2G47110 55 / 5e-10
UBQ6
ubiquitin 6 (.1.2)
AT3G52590 54 / 5e-10
HAP4, ERD16, UBQ1, EMB2167
HAPLESS 4, EARLY-RESPONSIVE TO DEHYDRATION 16, EMBRYO DEFECTIVE 2167, ubiquitin extension protein 1 (.1)
AT2G36170 54 / 5e-10
Ubiquitin supergroup;Ribosomal protein L40e (.1)
AT3G62250 55 / 6e-10
UBQ5
ubiquitin 5 (.1)
AT4G05050 55 / 6e-10
UBQ11
ubiquitin 11 (.1.2.3.4)
AT2G35635 54 / 8e-10
UBQ7, RUB2
RELATED TO UBIQUITIN 2, ubiquitin 7 (.1)
AT1G31340 54 / 8e-10
NEDD8, ATRUB1, RUB1
ARABIDOPSIS THALIANA RELATED TO UBIQUITIN 1, related to ubiquitin 1 (.1)
AT4G02890 55 / 1e-09
UBQ14
Ubiquitin family protein (.1.2.3.4)
AT4G05320 55 / 2e-09
UBQ10
polyubiquitin 10 (.1.2.3.4.5.6)
Paralogs
Gene ID
BLAST score/e-value
At best hit
BLAST score/e-value
TAIR10 short description
Potri.016G077000
54 / 2e-10
AT3G52590 194 / 1e-65
HAPLESS 4, EARLY-RESPONSIVE TO DEHYDRATION 16, EMBRYO DEFECTIVE 2167, ubiquitin extension protein 1 (.1)
Potri.016G077200
54 / 4e-10
AT3G52590 260 / 2e-91
HAPLESS 4, EARLY-RESPONSIVE TO DEHYDRATION 16, EMBRYO DEFECTIVE 2167, ubiquitin extension protein 1 (.1)
Potri.012G024300
54 / 4e-10
AT3G52590 260 / 2e-91
HAPLESS 4, EARLY-RESPONSIVE TO DEHYDRATION 16, EMBRYO DEFECTIVE 2167, ubiquitin extension protein 1 (.1)
Potri.015G007100
54 / 4e-10
AT3G52590 260 / 2e-91
HAPLESS 4, EARLY-RESPONSIVE TO DEHYDRATION 16, EMBRYO DEFECTIVE 2167, ubiquitin extension protein 1 (.1)
Potri.014G115100
55 / 5e-10
AT2G47110 255 / 2e-88
ubiquitin 6 (.1.2)
Potri.015G111500
55 / 5e-10
AT2G47110 257 / 3e-89
ubiquitin 6 (.1.2)
Potri.002G190000
55 / 5e-10
AT2G47110 257 / 3e-89
ubiquitin 6 (.1.2)
Potri.012G114000
55 / 5e-10
AT2G47110 257 / 3e-89
ubiquitin 6 (.1.2)
Potri.001G025300
55 / 5e-10
AT2G47110 257 / 3e-89
ubiquitin 6 (.1.2)
PFAM info
Clan ID
Clan name
Pfam ID
Pfam name
Pfam description
CL0072
Ubiquitin
PF00240
ubiquitin
Ubiquitin family
Representative CDS sequence
>Potri.006G045300.1 pacid=42768183 polypeptide=Potri.006G045300.1.p locus=Potri.006G045300 ID=Potri.006G045300.1.v4.1 annot-version=v4.1
ATGCAGATCACCGTGGACATCATACTTGGAGGCAAACGAATCACTCTGGACGTGGCGAGCACAGATAACATCTCGAGCGTCAAGGCCAAAATCAAAGAAA
CAGAAGGGATTCCTATTGAGCAGCAATATTTATATTATGATAGCCGGTTGCTGCTCGACACGGATATCCTTGAACATTGCGGGGTCAAGAACGATGATAC
ACTTCGTCTAGTCAACCTTGAGGGGCTCGAACAGGATGACGACGACGAGGACTACGACGACGATGATGACAACGACCATGGGAGACAAGATCCTTTTACA
GGTGTGTTGCTAATGAGTGCTAGTGTCCCTCGTCGTCGTCGTCGTCGTTCTCGTCGTTCTCGTCCTCGTCGTCAAGATGATGTTATAATTGTTTATCCGC
CAATGCCACGGCCACCACCATCACCAGAATGCAAATGTCAATAA
AA sequence
>Potri.006G045300.1 pacid=42768183 polypeptide=Potri.006G045300.1.p locus=Potri.006G045300 ID=Potri.006G045300.1.v4.1 annot-version=v4.1
MQITVDIILGGKRITLDVASTDNISSVKAKIKETEGIPIEQQYLYYDSRLLLDTDILEHCGVKNDDTLRLVNLEGLEQDDDDEDYDDDDDNDHGRQDPFT
GVLLMSASVPRRRRRRSRRSRPRRQDDVIIVYPPMPRPPPSPECKCQ
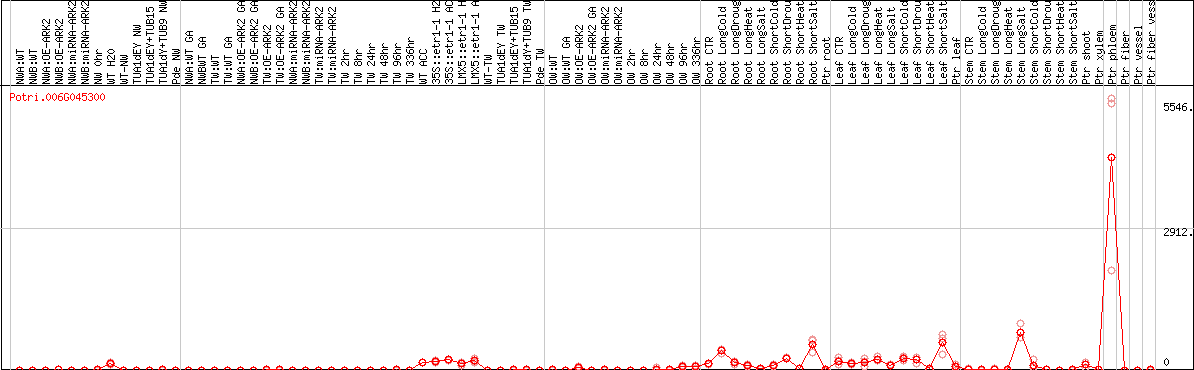
DESeq2's median of ratios [POPLAR]
Coexpressed genes
Potri.006G045300 coexpression network
*The number of genes in the network is adjusted within 50 genes.
*Gene name represents symbol(s) of closest Arabidopsis gene if symbol(s) for the gene itself doesn't exist.
*Circle diameter represents the number of connection with other genes within this network.
*Color for gene name represents subnetwork based on the result of network clustering.