Potri.015G016000 [POPLAR]


External link
JGI Phytozome v13PopgenieAspWood                  
Symbol
Arabidopsis homologues
Locus ID BLAST score/e-value TF class Alias TAIR10 short description
AT4G01500 47 / 4e-07 B3 NGA4 NGATHA4, AP2/B3-like transcriptional factor family protein (.1)
AT1G34390 47 / 6e-07 ARF ARF22 auxin response factor 22 (.1)
AT1G01030 45 / 3e-06 B3 NGA3 NGATHA3, AP2/B3-like transcriptional factor family protein (.1)
AT1G35520 43 / 1e-05 ARF ARF15 auxin response factor 15 (.1)
AT1G35540 42 / 3e-05 ARF ARF14 auxin response factor 14 (.1)
AT1G43950 41 / 4e-05 ARF ARF23 auxin response factor 23 (.1)
AT1G35240 41 / 5e-05 ARF ARF20 auxin response factor 20 (.1)
AT3G25730 41 / 7e-05 AP2_ERF EDF3 ethylene response DNA binding factor 3 (.1)
AT1G34310 40 / 0.0002 ARF ARF12 auxin response factor 12 (.1)
AT2G46870 38 / 0.0006 B3 NGA1 NGATHA1, AP2/B3-like transcriptional factor family protein (.1)
Paralogs
Gene ID BLAST score/e-value At best hit BLAST score/e-value TAIR10 short description
Potri.015G016100 206 / 3e-70 AT4G01500 54 / 2e-09 NGATHA4, AP2/B3-like transcriptional factor family protein (.1)
Potri.012G013167 142 / 7e-45 AT1G43950 49 / 1e-07 auxin response factor 23 (.1)
Potri.012G012850 141 / 1e-44 AT4G01500 49 / 6e-08 NGATHA4, AP2/B3-like transcriptional factor family protein (.1)
Potri.015G016450 140 / 2e-44 AT4G01500 47 / 4e-07 NGATHA4, AP2/B3-like transcriptional factor family protein (.1)
Potri.012G013700 140 / 4e-44 AT4G01500 52 / 6e-09 NGATHA4, AP2/B3-like transcriptional factor family protein (.1)
Potri.015G016901 138 / 2e-43 AT1G34390 49 / 1e-07 auxin response factor 22 (.1)
Potri.012G012950 137 / 3e-43 AT1G35520 49 / 9e-08 auxin response factor 15 (.1)
Potri.015G016700 137 / 4e-43 AT1G34390 46 / 1e-06 auxin response factor 22 (.1)
Potri.012G013000 135 / 2e-42 AT4G01500 46 / 9e-07 NGATHA4, AP2/B3-like transcriptional factor family protein (.1)
Flax homologues
Locus ID BLAST score/e-value At best hit BLAST score/e-value TAIR10 short description
Lus10030240 46 / 1e-06 AT2G46530 381 / 1e-126 auxin response factor 11 (.1.2.3)
Lus10005264 40 / 0.0001 AT2G33860 580 / 0.0 ETTIN, AUXIN RESPONSE TRANSCRIPTION FACTOR 3, Transcriptional factor B3 family protein / auxin-responsive factor AUX/IAA-related (.1)
Lus10000748 40 / 0.0001 AT4G33280 54 / 3e-08 AP2/B3-like transcriptional factor family protein (.1)
Lus10013942 40 / 0.0002 AT2G33860 579 / 0.0 ETTIN, AUXIN RESPONSE TRANSCRIPTION FACTOR 3, Transcriptional factor B3 family protein / auxin-responsive factor AUX/IAA-related (.1)
Lus10026510 39 / 0.0006 AT4G30080 694 / 0.0 auxin response factor 16 (.1)
Lus10040906 38 / 0.0007 AT5G62000 367 / 2e-114 ORESARA 14, HLS1 SUPPRESSOR, ARF1-BINDING PROTEIN, auxin response factor 2 (.1.2.3.4)
Lus10005930 38 / 0.0008 AT5G62000 361 / 2e-112 ORESARA 14, HLS1 SUPPRESSOR, ARF1-BINDING PROTEIN, auxin response factor 2 (.1.2.3.4)
Lus10021467 38 / 0.0008 AT4G30080 588 / 0.0 auxin response factor 16 (.1)
PFAM info
Clan ID Clan name Pfam ID Pfam name Pfam description
CL0405 DNA_b-psBarrel PF02362 B3 B3 DNA binding domain
Representative CDS sequence
>Potri.015G016000.1 pacid=42776290 polypeptide=Potri.015G016000.1.p locus=Potri.015G016000 ID=Potri.015G016000.1.v4.1 annot-version=v4.1
ATGGCTAGCTGCTCCAAGATCCTCACCAAGACAGATACTGAGAAGAGACTGTCAGTGCCTTCCAAGTTTCTCAAGTCTCTCCCACCATTCAAAGGCGGCC
ATGCGGTGTTTTTTCAAGCTAAAGAGGAGAGAGGCAAAGTCTGGACTTTTCAGTGCTCCACTCGCAAGAAAGGGCCGTATCAGAAGCCAGTTCTTTCCAG
GGGTTGGCTTGCATTTGCGAGGAAGAAGAAACTTGAAGTGGGTGACAAGATCGAGTTTTACAAGGCTAGAGATCAAGAAACTGAAAAACCCTTTTATGGA
GTTCGAGTTGAAAGAGAAATCAAGATACTCGGTGCTGTTATTGGCTGTATGAACCCTTAA
AA sequence
>Potri.015G016000.1 pacid=42776290 polypeptide=Potri.015G016000.1.p locus=Potri.015G016000 ID=Potri.015G016000.1.v4.1 annot-version=v4.1
MASCSKILTKTDTEKRLSVPSKFLKSLPPFKGGHAVFFQAKEERGKVWTFQCSTRKKGPYQKPVLSRGWLAFARKKKLEVGDKIEFYKARDQETEKPFYG
VRVEREIKILGAVIGCMNP

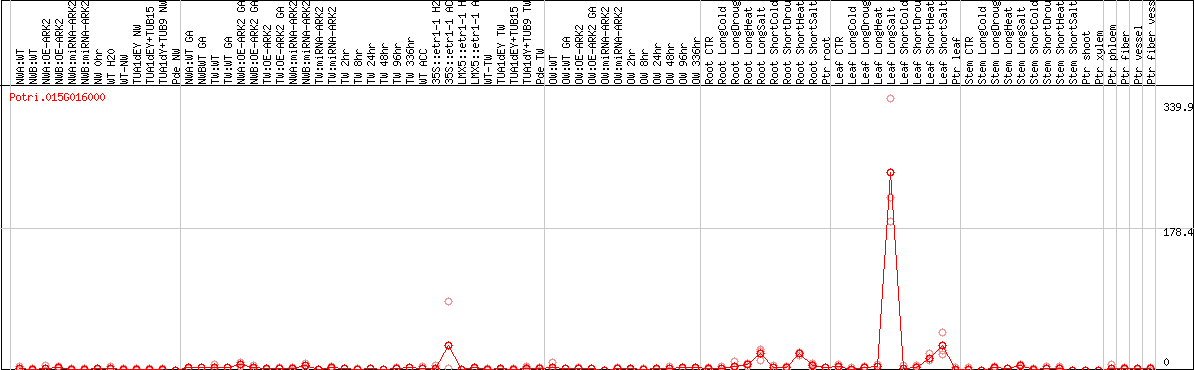
DESeq2's median of ratios [POPLAR]

Mapped by: Order by: Show schematic diagram

Coexpressed genes

Only top 10 genes are shown Show allDownload tab-delimited text
Schematic diagram [FLAX] Schematic diagram [POPLAR]

*If you select 4 or less genes and then press "compare expression", expression will be shown as a graph. If you select more than 4 genes, expresion will be shown as a heat map.
*Color represents relative expression level among samples for each gene.
At best At TF class At alias At description Locus MR r Symbol NWA:WTNWB:WTNWA:OE-ARK2NWB:OE-ARK2NWA:miRNA-ARK2NWB:miRNA-ARK2NW 0hrWT H20WT-NWTUA1dEY NWTUA1dEY+TUB15 NWTUA1dY+TUB9 NWPde NWNWA:WT GANWBWT GATW:WTTW:WT GANWA:OE-ARK2 GANWB:OE-ARK2 GATW:OE-ARK2TW:OE-ARK2 GANWA:miRNA-ARK2 GANWB:miRNA-ARK2 GATW:miRNA-ARK2TW:miRNA-ARK2 GATW 2hrTW 8hrTW 24hrTW 48hrTW 96hrTW 336hrWT ACC35S::etr1-1 H2035S::etr1-1 ACCLMX5::etr1-1 H20LMX5::etr1-1 ACCWT-TWTUA1dEY TWTUA1dEY+TUB15 TWTUA1dY+TUB9 TWPde TWOW:WTOW:WT GAOW:OE-ARK2OW:OE-ARK2 GAOW:miRNA-ARK2OW:miRNA-ARK2 GAOW 2hrOW 8hrOW 24hrOW 48hrOW 96hrOW 336hrRoot CTRRoot LongColdRoot LongDrougtRoot LongHeatRoot LongSaltRoot ShortColdRoot ShortDrougtRoot ShortHeatRoot ShortSaltPtr rootLeaf CTRLeaf LongColdLeaf LongDrougtLeaf LongHeatLeaf LongSaltLeaf ShortColdLeaf ShortDrougtLeaf ShortHeatLeaf ShortSaltPtr leafStem CTRStem LongColdStem LongDrougtStem LongHeatStem LongSaltStem ShortColdStem ShortDrougtStem ShortHeatStem ShortSaltPtr shootPtr xylemPtr phloemPtr fiberPtr vesselPtr fiber vessel ray
AT4G01500 B3 NGA4 NGATHA4, AP2/B3-like transcrip... Potri.015G016000 0 1
Potri.007G013700 2.82 0.9849
AT2G29120 ATGLR2.7 GLUTAMATE RECEPTOR 2.7, gluta... Potri.001G374700 11.53 0.9864
Potri.006G260985 13.26 0.9861
Potri.001G091400 20.19 0.9860
AT2G29120 ATGLR2.7 GLUTAMATE RECEPTOR 2.7, gluta... Potri.001G374600 23.32 0.9859
AT5G54160 ATOMT1 O-methyltransferase 1 (.1) Potri.013G017210 24.49 0.9355
AT3G52720 CAH1, ATACA1, A... A. THALIANA ALPHA CARBONIC ANH... Potri.006G212900 25.21 0.9581
AT2G29120 ATGLR2.7 GLUTAMATE RECEPTOR 2.7, gluta... Potri.001G374800 26.26 0.9858
AT1G16260 Wall-associated kinase family ... Potri.003G185800 27.38 0.9850
AT1G13260 AP2_ERF EDF4, RAV1 ETHYLENE RESPONSE DNA BINDING ... Potri.004G219450 34.46 0.9849

Potri.015G016000 coexpression network

*The number of genes in the network is adjusted within 50 genes.
*Gene name represents symbol(s) of closest Arabidopsis gene if symbol(s) for the gene itself doesn't exist.
*Circle diameter represents the number of connection with other genes within this network.
*Color for gene name represents subnetwork based on the result of network clustering.