Pt-BAS1.2,PtrcPrx2-cysA (Potri.016G072100) [POPLAR]


External link
JGI Phytozome v13PopgenieAspWood                  
Symbol Pt-BAS1.2,PtrcPrx2-cysA
Arabidopsis homologues
Locus ID BLAST score/e-value TF class Alias TAIR10 short description
AT5G06290 390 / 3e-138 2CPB, 2-CysPrxB ,2-Cys Prx B 2-CYS PEROXIREDOXIN B, 2-cysteine peroxiredoxin B (.1)
AT3G11630 385 / 3e-136 Thioredoxin superfamily protein (.1)
AT1G48130 95 / 2e-23 ATPER1 1-cysteine peroxiredoxin 1 (.1)
AT3G26060 78 / 5e-17 ATPRXQ ,ATPRX Q peroxiredoxin Q, Thioredoxin superfamily protein (.1.2)
Paralogs
Gene ID BLAST score/e-value At best hit BLAST score/e-value TAIR10 short description
Potri.006G204900 465 / 6e-168 AT5G06290 385 / 2e-136 2-CYS PEROXIREDOXIN B, 2-cysteine peroxiredoxin B (.1)
Potri.008G099900 92 / 2e-21 AT1G48130 322 / 2e-111 1-cysteine peroxiredoxin 1 (.1)
Potri.018G063300 79 / 3e-17 AT3G26060 275 / 1e-94 peroxiredoxin Q, Thioredoxin superfamily protein (.1.2)
Potri.006G137500 76 / 3e-16 AT3G26060 286 / 5e-99 peroxiredoxin Q, Thioredoxin superfamily protein (.1.2)
Flax homologues
Locus ID BLAST score/e-value At best hit BLAST score/e-value TAIR10 short description
Lus10016969 421 / 2e-150 AT5G06290 403 / 2e-143 2-CYS PEROXIREDOXIN B, 2-cysteine peroxiredoxin B (.1)
Lus10021295 417 / 8e-149 AT5G06290 404 / 6e-144 2-CYS PEROXIREDOXIN B, 2-cysteine peroxiredoxin B (.1)
Lus10018342 94 / 4e-23 AT1G48130 338 / 2e-119 1-cysteine peroxiredoxin 1 (.1)
Lus10017112 94 / 5e-23 AT1G48130 335 / 3e-118 1-cysteine peroxiredoxin 1 (.1)
Lus10033424 77 / 1e-16 AT3G26060 278 / 1e-95 peroxiredoxin Q, Thioredoxin superfamily protein (.1.2)
Lus10034892 75 / 7e-16 AT3G26060 281 / 6e-97 peroxiredoxin Q, Thioredoxin superfamily protein (.1.2)
Lus10004221 72 / 4e-14 AT5G27720 182 / 2e-57 SM-like protein 4, embryo defective 1644, Small nuclear ribonucleoprotein family protein (.1)
PFAM info
Clan ID Clan name Pfam ID Pfam name Pfam description
CL0172 Thioredoxin PF08534 Redoxin Redoxin
CL0172 PF10417 1-cysPrx_C C-terminal domain of 1-Cys peroxiredoxin
Representative CDS sequence
>Potri.016G072100.2 pacid=42809567 polypeptide=Potri.016G072100.2.p locus=Potri.016G072100 ID=Potri.016G072100.2.v4.1 annot-version=v4.1
ATGGCCTGCTCAGCTACCTCCACCACTCTCATCTCCTCTATCGCCGCCGCCGCCACCGCCACCACCACCAAATCCATGGCCTTTCCTATCTCTAAAAACA
TAACTCTCCCCAACTCATTTTTTGGCACTCGCAAATCCTTCCAATCTCGCGTCCCTCGTTCCATTTCCTTGACTCGTGGCTCTCATTCTAGAAGCACCTT
CGTTGTCAAAGCCTCTAGCGAACTTCCATTGGTCGGAAACATAGCACCGGATTTCGAGGCGGAGGCTGTCTTCGATCAAGAGTTCATTAATGTTAAACTG
TCTGATTATATTGGGAAGAAATATGTGATTCTATTTTTCTATCCATTGGACTTCACATTTGTTTGTCCCACAGAAATCACTGCTTTTAGTGACCGTCATG
AGGAATTTGAGCAGATAAACACAGAAGTGTTGGGTGTTTCAATCGACAGTGTGTTCTCGCACCTTGCCTGGGTCCAAACAGATAGAAAGTCTGGTGGGCT
TGGAGATTTGAAGTATCCTTTGATTTCTGATGTCACCAAATCCATTTCAAAATCTTATGGAGTGCTAATTCCTGATCAGGGAGTTGCTCTGAGAGGACTT
TTCATCATTGATAAAGAAGGAGTCATCCAACATTCCACCATTAACAACCTTGCCATTGGGCGTAGTGTTGACGAGACGAAGAGGACACTCCAGGCCTTGC
AGTATGTGCAAGAAAATCCAGATGAAGTTTGCCCAGCTGGGTGGAAGCCTGGTGAGAAGTCCATGAAGCCTGATCCAAAGCTGAGCAAGGATTACTTTGC
TGCCATATAG
AA sequence
>Potri.016G072100.2 pacid=42809567 polypeptide=Potri.016G072100.2.p locus=Potri.016G072100 ID=Potri.016G072100.2.v4.1 annot-version=v4.1
MACSATSTTLISSIAAAATATTTKSMAFPISKNITLPNSFFGTRKSFQSRVPRSISLTRGSHSRSTFVVKASSELPLVGNIAPDFEAEAVFDQEFINVKL
SDYIGKKYVILFFYPLDFTFVCPTEITAFSDRHEEFEQINTEVLGVSIDSVFSHLAWVQTDRKSGGLGDLKYPLISDVTKSISKSYGVLIPDQGVALRGL
FIIDKEGVIQHSTINNLAIGRSVDETKRTLQALQYVQENPDEVCPAGWKPGEKSMKPDPKLSKDYFAAI

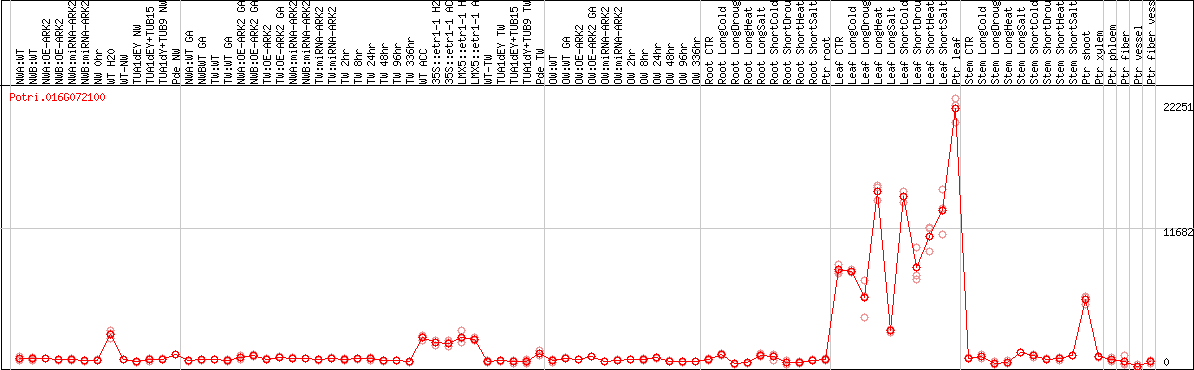
DESeq2's median of ratios [POPLAR]

Mapped by: Order by: Show schematic diagram

Coexpressed genes

Only top 10 genes are shown Show allDownload tab-delimited text
Schematic diagram [FLAX] Schematic diagram [POPLAR]

*If you select 4 or less genes and then press "compare expression", expression will be shown as a graph. If you select more than 4 genes, expresion will be shown as a heat map.
*Color represents relative expression level among samples for each gene.
At best At TF class At alias At description Locus MR r Symbol NWA:WTNWB:WTNWA:OE-ARK2NWB:OE-ARK2NWA:miRNA-ARK2NWB:miRNA-ARK2NW 0hrWT H20WT-NWTUA1dEY NWTUA1dEY+TUB15 NWTUA1dY+TUB9 NWPde NWNWA:WT GANWBWT GATW:WTTW:WT GANWA:OE-ARK2 GANWB:OE-ARK2 GATW:OE-ARK2TW:OE-ARK2 GANWA:miRNA-ARK2 GANWB:miRNA-ARK2 GATW:miRNA-ARK2TW:miRNA-ARK2 GATW 2hrTW 8hrTW 24hrTW 48hrTW 96hrTW 336hrWT ACC35S::etr1-1 H2035S::etr1-1 ACCLMX5::etr1-1 H20LMX5::etr1-1 ACCWT-TWTUA1dEY TWTUA1dEY+TUB15 TWTUA1dY+TUB9 TWPde TWOW:WTOW:WT GAOW:OE-ARK2OW:OE-ARK2 GAOW:miRNA-ARK2OW:miRNA-ARK2 GAOW 2hrOW 8hrOW 24hrOW 48hrOW 96hrOW 336hrRoot CTRRoot LongColdRoot LongDrougtRoot LongHeatRoot LongSaltRoot ShortColdRoot ShortDrougtRoot ShortHeatRoot ShortSaltPtr rootLeaf CTRLeaf LongColdLeaf LongDrougtLeaf LongHeatLeaf LongSaltLeaf ShortColdLeaf ShortDrougtLeaf ShortHeatLeaf ShortSaltPtr leafStem CTRStem LongColdStem LongDrougtStem LongHeatStem LongSaltStem ShortColdStem ShortDrougtStem ShortHeatStem ShortSaltPtr shootPtr xylemPtr phloemPtr fiberPtr vesselPtr fiber vessel ray
AT5G06290 2CPB, 2-CysPrxB... 2-CYS PEROXIREDOXIN B, 2-cyste... Potri.016G072100 0 1 Pt-BAS1.2,PtrcPrx2-cysA
AT5G40950 RPL27 ribosomal protein large subuni... Potri.001G329500 1.00 0.9876 Pt-RPL27.5
AT5G14910 Heavy metal transport/detoxifi... Potri.001G350500 2.44 0.9851
AT1G21350 Thioredoxin superfamily protei... Potri.002G071000 2.82 0.9815
AT1G55670 PSAG photosystem I subunit G (.1) Potri.001G471900 3.87 0.9843 Pt-PSAG.1
AT2G28190 CZSOD2, CSD2 copper/zinc superoxide dismuta... Potri.009G163200 4.24 0.9836
AT4G02530 chloroplast thylakoid lumen pr... Potri.006G067600 4.58 0.9816
AT5G65220 Ribosomal L29 family protein ... Potri.007G093700 4.89 0.9850
AT4G12800 PSAL photosystem I subunit l (.1) Potri.014G175600 4.89 0.9846 PSAL.2
AT3G23760 unknown protein Potri.015G108200 5.47 0.9787
AT5G30510 ARRPS1, RPS1 ribosomal protein S1 (.1) Potri.010G150300 5.47 0.9812

Potri.016G072100 coexpression network

*The number of genes in the network is adjusted within 50 genes.
*Gene name represents symbol(s) of closest Arabidopsis gene if symbol(s) for the gene itself doesn't exist.
*Circle diameter represents the number of connection with other genes within this network.
*Color for gene name represents subnetwork based on the result of network clustering.