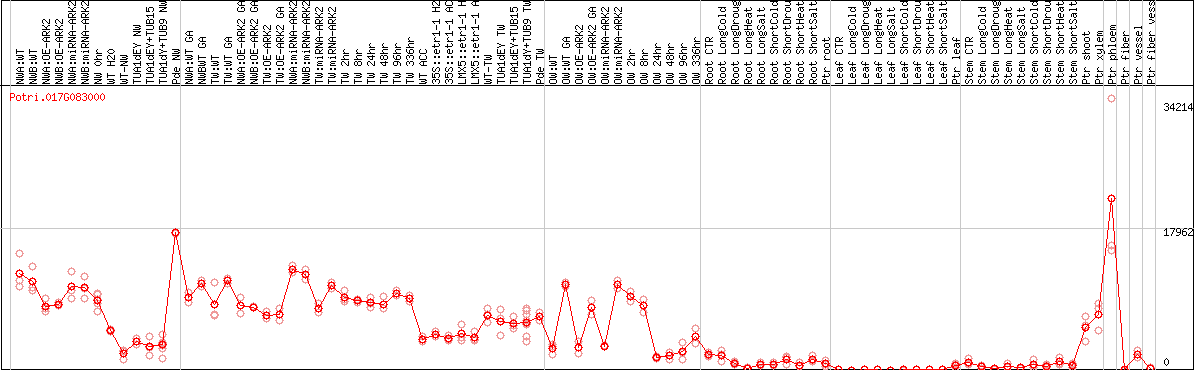
GASA4.2 (Potri.017G083000) [POPLAR]


External link
JGI Phytozome v13PopgenieAspWood                  
Symbol GASA4.2
Arabidopsis homologues
Locus ID BLAST score/e-value TF class Alias TAIR10 short description
AT5G15230 117 / 2e-35 GASA4 GAST1 protein homolog 4 (.1.2)
AT1G74670 99 / 4e-28 GASA6 GA-stimulated Arabidopsis 6, Gibberellin-regulated family protein (.1)
AT2G30810 72 / 1e-17 Gibberellin-regulated family protein (.1)
AT3G10185 71 / 3e-17 Gibberellin-regulated family protein (.1)
AT3G02885 69 / 1e-16 GASA5 GAST1 protein homolog 5 (.1)
AT1G10588 48 / 2e-08 Gibberellin-regulated family protein (.1.2)
AT2G39540 45 / 2e-07 Gibberellin-regulated family protein (.1)
AT4G09610 43 / 2e-06 GASA2 GAST1 protein homolog 2 (.1)
AT1G22690 42 / 4e-06 Gibberellin-regulated family protein (.1.2.3)
AT4G09600 40 / 3e-05 GASA3 GAST1 protein homolog 3 (.1)
Paralogs
Gene ID BLAST score/e-value At best hit BLAST score/e-value TAIR10 short description
Potri.001G254100 70 / 1e-16 AT1G74670 111 / 4e-33 GA-stimulated Arabidopsis 6, Gibberellin-regulated family protein (.1)
Potri.006G044400 64 / 2e-14 AT1G74670 108 / 9e-32 GA-stimulated Arabidopsis 6, Gibberellin-regulated family protein (.1)
Potri.017G124200 64 / 2e-14 AT3G02885 101 / 1e-29 GAST1 protein homolog 5 (.1)
Potri.001G315500 58 / 2e-12 AT2G30810 91 / 5e-25 Gibberellin-regulated family protein (.1)
Potri.014G020100 51 / 1e-09 AT5G59845 99 / 9e-29 Gibberellin-regulated family protein (.1)
Potri.013G113400 50 / 5e-09 AT2G18420 96 / 2e-27 Gibberellin-regulated family protein (.1)
Potri.019G083900 45 / 6e-07 AT1G22690 103 / 1e-29 Gibberellin-regulated family protein (.1.2.3)
Potri.001G297700 41 / 8e-06 AT2G14900 96 / 2e-27 Gibberellin-regulated family protein (.1)
Potri.009G092600 41 / 9e-06 AT2G14900 99 / 2e-28 Gibberellin-regulated family protein (.1)
Flax homologues
Locus ID BLAST score/e-value At best hit BLAST score/e-value TAIR10 short description
Lus10030680 127 / 2e-39 AT5G15230 131 / 5e-41 GAST1 protein homolog 4 (.1.2)
Lus10002059 106 / 5e-31 AT1G74670 132 / 1e-41 GA-stimulated Arabidopsis 6, Gibberellin-regulated family protein (.1)
Lus10042203 100 / 5e-29 AT1G74670 138 / 6e-44 GA-stimulated Arabidopsis 6, Gibberellin-regulated family protein (.1)
Lus10008612 95 / 1e-26 AT1G74670 138 / 8e-44 GA-stimulated Arabidopsis 6, Gibberellin-regulated family protein (.1)
Lus10029340 72 / 9e-18 AT2G30810 108 / 3e-32 Gibberellin-regulated family protein (.1)
Lus10024216 73 / 2e-17 AT1G74670 106 / 1e-30 GA-stimulated Arabidopsis 6, Gibberellin-regulated family protein (.1)
Lus10018016 64 / 2e-14 AT1G74670 110 / 2e-32 GA-stimulated Arabidopsis 6, Gibberellin-regulated family protein (.1)
Lus10004048 62 / 1e-13 AT1G74670 109 / 1e-32 GA-stimulated Arabidopsis 6, Gibberellin-regulated family protein (.1)
Lus10042012 55 / 8e-11 AT1G74670 96 / 6e-27 GA-stimulated Arabidopsis 6, Gibberellin-regulated family protein (.1)
Lus10001407 49 / 1e-08 AT5G59845 95 / 6e-27 Gibberellin-regulated family protein (.1)
PFAM info
Clan ID Clan name Pfam ID Pfam name Pfam description
PF02704 GASA Gibberellin regulated protein
Representative CDS sequence
>Potri.017G083000.1 pacid=42814601 polypeptide=Potri.017G083000.1.p locus=Potri.017G083000 ID=Potri.017G083000.1.v4.1 annot-version=v4.1
ATGGCTAAGTTTGTTGCTGTCTTCCTCTTGGCTCTCATTGCCATTTCCATGCTCCAAACCTTGGTTGTGGCATCCCATGGGCGTGGAGGTCACCACAATA
ACAACAAGAACAAATATGGACCTGGGAGTCTCAAGAGCTTCCAATGTCCATCACAATGCACGAGGAGGTGTAGCAAGACCCAGTACCATAAGCCATGCAT
GTTCTTCTGTCAGAAGTGCTGCAAGAAGTGCCTCTGCGTTCCCCCAGGGTATTATGGGAATAAAGCTGTGTGCCCTTGCTACAACAACTGGAAGACCAAG
GAAGGAGGGCCTAAGTGCCCTTGA
AA sequence
>Potri.017G083000.1 pacid=42814601 polypeptide=Potri.017G083000.1.p locus=Potri.017G083000 ID=Potri.017G083000.1.v4.1 annot-version=v4.1
MAKFVAVFLLALIAISMLQTLVVASHGRGGHHNNNKNKYGPGSLKSFQCPSQCTRRCSKTQYHKPCMFFCQKCCKKCLCVPPGYYGNKAVCPCYNNWKTK
EGGPKCP

DESeq2's median of ratios [POPLAR]

Mapped by: Order by: Show schematic diagram

Coexpressed genes

Only top 10 genes are shown Show allDownload tab-delimited text
Schematic diagram [FLAX] Schematic diagram [POPLAR]

*If you select 4 or less genes and then press "compare expression", expression will be shown as a graph. If you select more than 4 genes, expresion will be shown as a heat map.
*Color represents relative expression level among samples for each gene.
At best At TF class At alias At description Locus MR r Symbol NWA:WTNWB:WTNWA:OE-ARK2NWB:OE-ARK2NWA:miRNA-ARK2NWB:miRNA-ARK2NW 0hrWT H20WT-NWTUA1dEY NWTUA1dEY+TUB15 NWTUA1dY+TUB9 NWPde NWNWA:WT GANWBWT GATW:WTTW:WT GANWA:OE-ARK2 GANWB:OE-ARK2 GATW:OE-ARK2TW:OE-ARK2 GANWA:miRNA-ARK2 GANWB:miRNA-ARK2 GATW:miRNA-ARK2TW:miRNA-ARK2 GATW 2hrTW 8hrTW 24hrTW 48hrTW 96hrTW 336hrWT ACC35S::etr1-1 H2035S::etr1-1 ACCLMX5::etr1-1 H20LMX5::etr1-1 ACCWT-TWTUA1dEY TWTUA1dEY+TUB15 TWTUA1dY+TUB9 TWPde TWOW:WTOW:WT GAOW:OE-ARK2OW:OE-ARK2 GAOW:miRNA-ARK2OW:miRNA-ARK2 GAOW 2hrOW 8hrOW 24hrOW 48hrOW 96hrOW 336hrRoot CTRRoot LongColdRoot LongDrougtRoot LongHeatRoot LongSaltRoot ShortColdRoot ShortDrougtRoot ShortHeatRoot ShortSaltPtr rootLeaf CTRLeaf LongColdLeaf LongDrougtLeaf LongHeatLeaf LongSaltLeaf ShortColdLeaf ShortDrougtLeaf ShortHeatLeaf ShortSaltPtr leafStem CTRStem LongColdStem LongDrougtStem LongHeatStem LongSaltStem ShortColdStem ShortDrougtStem ShortHeatStem ShortSaltPtr shootPtr xylemPtr phloemPtr fiberPtr vesselPtr fiber vessel ray
AT5G15230 GASA4 GAST1 protein homolog 4 (.1.2) Potri.017G083000 0 1 GASA4.2
AT5G51560 Leucine-rich repeat protein ki... Potri.012G128700 1.00 0.9413
AT1G72210 bHLH bHLH096 basic helix-loop-helix (bHLH) ... Potri.013G025900 2.44 0.9262
AT3G17350 unknown protein Potri.010G152900 2.82 0.9327
AT2G46170 Reticulon family protein (.1.2... Potri.002G165400 3.87 0.9106
AT1G74520 ATHVA22A HVA22 homologue A (.1) Potri.015G062800 7.07 0.8848
AT5G15350 AtENODL17 early nodulin-like protein 17 ... Potri.017G088600 7.21 0.9154
AT1G21090 Cupredoxin superfamily protein... Potri.002G067600 8.06 0.9016
AT4G38660 Pathogenesis-related thaumatin... Potri.009G132500 8.48 0.9073
AT2G41820 Leucine-rich repeat protein ki... Potri.016G055400 8.94 0.9024
Potri.009G037500 9.79 0.8634

Potri.017G083000 coexpression network

*The number of genes in the network is adjusted within 50 genes.
*Gene name represents symbol(s) of closest Arabidopsis gene if symbol(s) for the gene itself doesn't exist.
*Circle diameter represents the number of connection with other genes within this network.
*Color for gene name represents subnetwork based on the result of network clustering.