External link
Symbol
Arabidopsis homologues
Locus ID
BLAST score/e-value
TF class
Alias
TAIR10 short description
AT2G23340 162 / 1e-51
AP2_ERF
DEAR3
DREB and EAR motif protein 3 (.1)
AT3G50260 159 / 2e-50
AP2_ERF
DEAR1, CEJ1, ATERF#011
DREB AND EAR MOTIF PROTEIN 1, cooperatively regulated by ethylene and jasmonate 1 (.1)
AT5G67190 156 / 4e-49
AP2_ERF
DEAR2
DREB and EAR motif protein 2 (.1)
AT4G36900 150 / 8e-47
AP2_ERF
DEAR4, RAP2.10
DREB AND EAR MOTIF PROTEIN 4, related to AP2 10 (.1)
AT1G46768 145 / 2e-45
AP2_ERF
RAP2.1
related to AP2 1 (.1)
AT4G06746 135 / 3e-41
AP2_ERF
DEAR5, RAP2.9
DREB AND EAR MOTIF PROTEIN 5, related to AP2 9 (.1)
AT4G16750 107 / 5e-30
AP2_ERF
Integrase-type DNA-binding superfamily protein (.1)
AT1G71450 99 / 1e-26
AP2_ERF
Integrase-type DNA-binding superfamily protein (.1)
AT1G21910 100 / 2e-26
AP2_ERF
DREB26
dehydration response element-binding protein 26, Integrase-type DNA-binding superfamily protein (.1)
AT1G74930 97 / 1e-25
AP2_ERF
ORA47, ERF018
Integrase-type DNA-binding superfamily protein (.1)
Paralogs
Gene ID
BLAST score/e-value
At best hit
BLAST score/e-value
TAIR10 short description
Lus10018727
174 / 2e-56
AT5G67190 162 / 1e-51
DREB and EAR motif protein 2 (.1)
Lus10009373
148 / 5e-46
AT5G67190 164 / 3e-52
DREB and EAR motif protein 2 (.1)
Lus10033420
100 / 1e-26
AT1G19210 181 / 4e-58
Integrase-type DNA-binding superfamily protein (.1)
Lus10009798
98 / 2e-26
AT1G19210 132 / 1e-39
Integrase-type DNA-binding superfamily protein (.1)
Lus10038082
99 / 3e-26
AT5G21960 155 / 3e-47
Integrase-type DNA-binding superfamily protein (.1)
Lus10002801
96 / 5e-25
AT5G11590 209 / 4e-68
TINY2, Integrase-type DNA-binding superfamily protein (.1)
Lus10001601
94 / 3e-24
AT5G11590 159 / 1e-48
TINY2, Integrase-type DNA-binding superfamily protein (.1)
Lus10034885
92 / 2e-23
AT1G19210 172 / 2e-54
Integrase-type DNA-binding superfamily protein (.1)
Lus10034949
93 / 3e-23
AT4G32800 169 / 3e-51
Integrase-type DNA-binding superfamily protein (.1)
PFAM info
Clan ID
Clan name
Pfam ID
Pfam name
Pfam description
CL0081
MBD-like
PF00847
AP2
AP2 domain
Representative CDS sequence
>Lus10010043 pacid=23155639 polypeptide=Lus10010043 locus=Lus10010043.g ID=Lus10010043.BGIv1.0 annot-version=v1.0
ATGGACGTTCGGCACCGCGACTCAACCTCACCGACCATCACAAGCAGCAACACGGAGAATAAGCGTAAGCACGTCGTAGAGAAGCCGTACAGGGGAATAA
GGATGAGGAAGTGGGGGAAGTGGGTGGCCGAGATTCGGGAGCCTAACAAGCGTTCAAGGATTTGGCTTGGTTCTTACTCCACCCCTGTCGCCGCCGCCAG
AGCCTACGACACCGCCGTCTTCTACCTTCGTGGTCCCTCCGCCCGCCTCAACTTCCCCGACTTGATTGACCACCTCACCCCACCCGACCACGCTGTATCC
GCCGCCTCCATCCGTCAGAAGGCCACCGAGATCGGCGCTCAAGTCGACGCCCTCCAAACCTCTACTACTACTACTCCAACATCTTCCTCAGGCGATCACT
CCAACGTCGTCATCCCGGAAAACCCCGACTTGAACGAGTACCCCAACCCAGAAAATTCGGACAACGAACAAGAGTAG
AA sequence
>Lus10010043 pacid=23155639 polypeptide=Lus10010043 locus=Lus10010043.g ID=Lus10010043.BGIv1.0 annot-version=v1.0
MDVRHRDSTSPTITSSNTENKRKHVVEKPYRGIRMRKWGKWVAEIREPNKRSRIWLGSYSTPVAAARAYDTAVFYLRGPSARLNFPDLIDHLTPPDHAVS
AASIRQKATEIGAQVDALQTSTTTTPTSSSGDHSNVVIPENPDLNEYPNPENSDNEQE
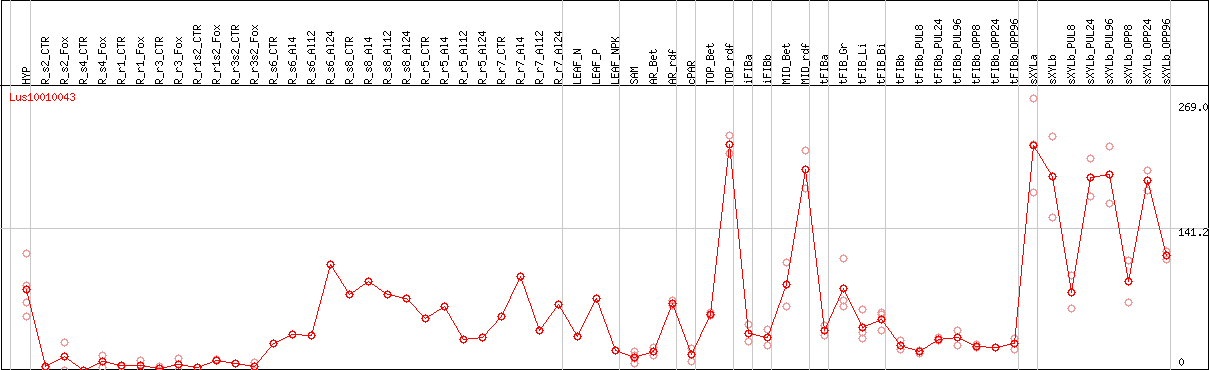
DESeq2's median of ratios [FLAX]
Coexpressed genes
Lus10010043 coexpression network
*The number of genes in the network is adjusted within 50 genes.
*Gene name represents symbol(s) of closest Arabidopsis gene if symbol(s) for the gene itself doesn't exist.
*Circle diameter represents the number of connection with other genes within this network.
*Color for gene name represents subnetwork based on the result of network clustering.