External link
Symbol
Arabidopsis homologues
Locus ID
BLAST score/e-value
TF class
Alias
TAIR10 short description
AT5G25190 103 / 2e-27
AP2_ERF
ESE3
ethylene and salt inducible 3, Integrase-type DNA-binding superfamily protein (.1)
AT1G15360 69 / 2e-14
AP2_ERF
WIN1, SHN1
WAX INDUCER 1, SHINE 1, Integrase-type DNA-binding superfamily protein (.1)
AT5G25390 67 / 1e-13
AP2_ERF
SHN3, SHN2
shine3, Integrase-type DNA-binding superfamily protein (.1.2)
AT5G11190 67 / 2e-13
AP2_ERF
SHN2, SHN3
shine2, Integrase-type DNA-binding superfamily protein (.1)
AT1G21910 54 / 8e-09
AP2_ERF
DREB26
dehydration response element-binding protein 26, Integrase-type DNA-binding superfamily protein (.1)
AT3G20310 54 / 8e-09
AP2_ERF
ATERF7, ATERF-7
ethylene response factor 7 (.1)
AT5G05410 54 / 2e-08
AP2_ERF
DREB2A
DEHYDRATION-RESPONSIVE ELEMENT BINDING PROTEIN 2, DRE-binding protein 2A (.1.2)
AT4G06746 52 / 3e-08
AP2_ERF
DEAR5, RAP2.9
DREB AND EAR MOTIF PROTEIN 5, related to AP2 9 (.1)
AT1G77640 52 / 4e-08
AP2_ERF
Integrase-type DNA-binding superfamily protein (.1)
AT5G21960 52 / 6e-08
AP2_ERF
Integrase-type DNA-binding superfamily protein (.1)
Paralogs
Gene ID
BLAST score/e-value
At best hit
BLAST score/e-value
TAIR10 short description
Lus10041023
99 / 1e-25
AT5G25190 205 / 7e-68
ethylene and salt inducible 3, Integrase-type DNA-binding superfamily protein (.1)
Lus10035859
94 / 5e-24
AT5G25190 196 / 9e-65
ethylene and salt inducible 3, Integrase-type DNA-binding superfamily protein (.1)
Lus10016815
93 / 1e-23
AT5G25190 206 / 1e-68
ethylene and salt inducible 3, Integrase-type DNA-binding superfamily protein (.1)
Lus10005343
91 / 4e-23
AT5G25190 174 / 3e-56
ethylene and salt inducible 3, Integrase-type DNA-binding superfamily protein (.1)
Lus10005716
82 / 9e-19
AT1G15360 236 / 3e-79
WAX INDUCER 1, SHINE 1, Integrase-type DNA-binding superfamily protein (.1)
Lus10030097
80 / 5e-18
AT1G15360 234 / 1e-78
WAX INDUCER 1, SHINE 1, Integrase-type DNA-binding superfamily protein (.1)
Lus10009480
69 / 2e-14
AT1G15360 207 / 1e-68
WAX INDUCER 1, SHINE 1, Integrase-type DNA-binding superfamily protein (.1)
Lus10019414
69 / 6e-14
AT1G15360 207 / 1e-67
WAX INDUCER 1, SHINE 1, Integrase-type DNA-binding superfamily protein (.1)
Lus10002015
66 / 2e-13
AT1G15360 183 / 4e-59
WAX INDUCER 1, SHINE 1, Integrase-type DNA-binding superfamily protein (.1)
Locus ID
BLAST score/e-value
At best hit
BLAST score/e-value
TAIR10 short description
Potri.001G048200
106 / 9e-29
AT5G25190 162 / 5e-51
ethylene and salt inducible 3, Integrase-type DNA-binding superfamily protein (.1)
Potri.006G261200
104 / 8e-28
AT5G25190 169 / 9e-54
ethylene and salt inducible 3, Integrase-type DNA-binding superfamily protein (.1)
Potri.018G021900
104 / 1e-27
AT5G25190 169 / 1e-53
ethylene and salt inducible 3, Integrase-type DNA-binding superfamily protein (.1)
Potri.003G179900
71 / 4e-15
AT5G25190 100 / 1e-26
ethylene and salt inducible 3, Integrase-type DNA-binding superfamily protein (.1)
Potri.018G131400
71 / 6e-15
AT1G15360 194 / 6e-63
WAX INDUCER 1, SHINE 1, Integrase-type DNA-binding superfamily protein (.1)
Potri.003G033000
68 / 4e-14
AT1G15360 181 / 3e-58
WAX INDUCER 1, SHINE 1, Integrase-type DNA-binding superfamily protein (.1)
Potri.018G028000
67 / 1e-13
AT5G11190 204 / 8e-68
shine2, Integrase-type DNA-binding superfamily protein (.1)
Potri.006G253800
67 / 2e-13
AT5G11190 197 / 1e-64
shine2, Integrase-type DNA-binding superfamily protein (.1)
Potri.006G069400
66 / 3e-13
AT1G15360 186 / 9e-60
WAX INDUCER 1, SHINE 1, Integrase-type DNA-binding superfamily protein (.1)
Potri.004G047600
52 / 5e-08
AT5G44210 99 / 2e-25
ERF DOMAIN PROTEIN- 9, erf domain protein 9 (.1)
PFAM info
Clan ID
Clan name
Pfam ID
Pfam name
Pfam description
CL0081
MBD-like
PF00847
AP2
AP2 domain
Representative CDS sequence
>Lus10041614 pacid=23146708 polypeptide=Lus10041614 locus=Lus10041614.g ID=Lus10041614.BGIv1.0 annot-version=v1.0
ATGGCGACTAGGCAGCAGCAGCAGCAACAACAACGATACCGTGGGGTCCGCCAGCGCCATTGGGGTTCCTGGGTCTCCGAAATTCGCCACCCTCTTCTGA
AGACGAGAATATGGCTGGGGACGTTCGAGTCGGCGGAAGACGCAGCAAGAGCGTACGACGAAGCAGCCCGCCTTATGTGTGGGCCTAAAGCTCGGACTAA
TTTTCCATACAGCCCGGCTCATGACCAAGCCCAAGCCCAGTCTTCTTCTACTTCTACTTCAAGCTTTCTCACGGGAGCGCTGGCCGCCAAGCTCCACAAA
TGCCACATGGCCTCTCTTCGAAGAATACCGCTCTCTTCCGCCAAGAAAAACAACTCCAAGAGCAAACCTCGTCATTACACAAATACTTCTTCTTCGAATT
CTACTAATGCAGTCAAAAATGAATTTGCAATTGATAAACATCACGAAGCAGCGCAATGCGGCGGCTGCGGCAGTAGGGACAGGGGAAGAAGTTGGGACGA
CAATGGCAGAGGAAGTTTGGAGAGGGGGGATCAAGCGACGGCGGGGGAGGTTGGTGCTGATGATGACATTATAATAGAGCAGATGATAGAGGAATTGCTC
GATTCTGGCACCTCCATTGAGCTTTCTCTTGTTACTAAACATCATCCTTGTCATTAA
AA sequence
>Lus10041614 pacid=23146708 polypeptide=Lus10041614 locus=Lus10041614.g ID=Lus10041614.BGIv1.0 annot-version=v1.0
MATRQQQQQQQRYRGVRQRHWGSWVSEIRHPLLKTRIWLGTFESAEDAARAYDEAARLMCGPKARTNFPYSPAHDQAQAQSSSTSTSSFLTGALAAKLHK
CHMASLRRIPLSSAKKNNSKSKPRHYTNTSSSNSTNAVKNEFAIDKHHEAAQCGGCGSRDRGRSWDDNGRGSLERGDQATAGEVGADDDIIIEQMIEELL
DSGTSIELSLVTKHHPCH
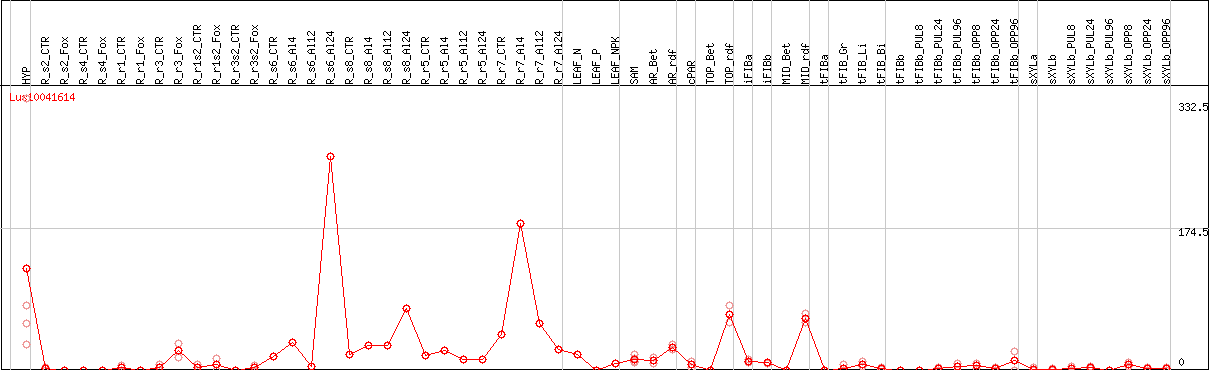
DESeq2's median of ratios [FLAX]
Coexpressed genes
Lus10041614 coexpression network
*The number of genes in the network is adjusted within 50 genes.
*Gene name represents symbol(s) of closest Arabidopsis gene if symbol(s) for the gene itself doesn't exist.
*Circle diameter represents the number of connection with other genes within this network.
*Color for gene name represents subnetwork based on the result of network clustering.